
In this tutorial, we will learn all that there is about Raspberry Pi SNMP Monitoring. I will show you step by step how to install, configure and enable an SNMP agent (server) on Raspberry Pi. And how to extend the capabilities of the SNMP agent so that you can monitor new parameters like the temperature sensor and power status.
Additionally, you can learn how to monitor your Raspberry Pi using a monitoring tool (SNMP manager) or a Net-SNMP tool (SnmpWalk / SnmpGet).
Are you familiar with the SNMP protocol? No? Don’t worry, I got you covered with my post – What is SNMP protocol? How does it work? Learn with examples. However, if you have a basic understanding of SNMP then continue with reading.
Table of Contents
Step 1: Install SNMP server and client packages
First make sure that Rpi repository is up to date
sudo apt update
Use “sudo apt update –allow-releaseinfo-change” if you receive the error: “E: Repository …’ changed its ‘Suite’ value from ‘ stable’ to ‘oldstable’ N: This must be accepted explicitly before updates for this repository can be applied …”
Then install the necessary SNMP server and client packages:
sudo apt -y install snmpd snmp
Nice work! Go to the next step.
Step 2: Configure and enable SNMP agent (server) on RPI
Open “snmpd.conf” configuration file with command:
sudo nano /etc/snmp/snmpd.conf
Comment the line “agentAddress udp:127.0.0.1:161” by adding “#” in front of it, and uncomment the line “#agentAddress udp:161,udp6:[::1]:161” by removing “#” so that the final configuration looks like this:
#  Listen for connections from the local system only
#agentAddress  udp:127.0.0.1:161
#  Listen for connections on all interfaces (both IPv4 *and* IPv6)
agentAddress udp:161,udp6:[::1]:161
Next, set SNMP community string by uncommenting the line “#rocommunity public localhost” and changing it to:
rocommunity public
For security reasons, I recommend that you change the community “public” to something else
Save and exit file (ctrl+x, followed by y and enter).
Restart the SNMP process with the command:
sudo systemctl restart snmpd
Step 3: Test SNMP monitoring on Raspberry Pi
Now use SnmpGet command and OID 1.3.6.1.2.1.1.1.0 (sysDescr) to test the SNMP agent:
pi@raspberrypi:~ $ snmpget -c public -v2c localhost 1.3.6.1.2.1.1.1.0
iso.3.6.1.2.1.1.1.0 = STRING: "Linux raspberrypi 4.19.118-v7l+ #1311 SMP Mon Apr 27 14:26:42 BST 2020 armv7l"
The above command will describe the system on which the SNMP agent is running, but you can find out much more! Here are some examples of SNMP OIDs that you can use to check your Raspberry Pi:
| OID description | OID |
| Uptime | 1.3.6.1.2.1.1.3.0 |
| Load average (1m avg) | 1.3.6.1.4.1.2021.10.1.3.1 |
| System name | 1.3.6.1.2.1.1.5.0 |
| Free memory | 1.3.6.1.4.1.2021.4.6.0 |
To see all the OIDs that are available please check and explore the UCD-SNMP-MIB or use “snmpwalk -c public -v2c localhost 1.3.6.1.2.1” command. And if you want to test SNMP with SnmpGet/SnmpWalk in more detail, check out my instructions: Snmpwalk Examples (v3, v2) & Commands for Linux / Windows.
CONGRATULATIONS!
You have successfully installed and configured SNMP agent on Raspberry Pi!
No need to do anything else as other steps are optional.
CONTINUE TO LEARN MORE:
How to monitor CPU temperature on Raspberry Pi using SNMP?
How to monitor power issues on Raspberry Pi using SNMP?
How to install and use Zabbix SNMP manager to monitor RPI devices?
Step 4: Monitor CPU temperature on RPI using SNMP
What if you want to monitor something on the Raspberry PI device that is not available in the SNMP MIB? In that case, you will need to write small scripts that will collect this new information and print out output in three lines: OID, data type (integer/string etc.), and actual data. I will demonstrate how to monitor temperature on the RPI CPU using SNMP.
a) Create a script
Crate a new file “SNMP-Temperature-Sensor-CPU” with the text editor:
sudo nano /usr/local/bin/SNMP-Temperature-Sensor-CPU
And insert this text into the file:
#!/bin/bash
if [ "$1" = "-g" ]; then
echo 1.3.6.1.2.1.25.1.8
echo gauge
cat /sys/class/thermal/thermal_zone0/temp
fi
exit 0
Save and exit file (ctrl+x, followed by y and enter).
b) Set appropriate permissions on the script
Next, set the appropriate permissions:
sudo chmod +x /usr/local/bin/SNMP-Temperature-Sensor-CPU
c) Link the script with the SNMP agent
Great job! Now we need to link the script with the SNMP agent. Open the “snmpd.conf” file:
sudo nano /etc/snmp/snmpd.conf
And insert this line into the file:
pass 1.3.6.1.2.1.25.1.8 /bin/sh /usr/local/bin/SNMP-Temperature-Sensor-CPU
d) Restart SNMP agent and test the script
Last thing, restart the SNMP agent with the command:
sudo systemctl restart snmpd
And test the new SNMP parameter with the command:
pi@raspberrypi:~ $ snmpget -c public -v2c localhost 1.3.6.1.2.1.25.1.8
iso.3.6.1.2.1.25.1.8 = Gauge32: 48199
You should receive CPU temperature in milli-degrees. In my case, the CPU temperature of Raspberry Pi is 48.199 C°.
Step 5: Monitor power issues on RPI using SNMP
Now that you know how to create a custom SNMP agent script, you can monitor anything, here’s another example for monitoring a power outage.
Crate a new file “SNMP-Power-Issues” with the text editor:
sudo nano /usr/local/bin/SNMP-Power-Issues
And insert this text into the file:
#!/bin/bash
if [ "$1" = "-g" ]; then
 echo 1.3.6.1.2.1.25.1.9
 echo gauge
 value=$( vcgencmd get_throttled | sed "s/throttled=0x//" | sed "s/000//" )
 echo $value
fi
exit 0
Set permissions:
sudo chmod +x /usr/local/bin/SNMP-Power-Issues
Link the script with the SNMP agent by adding this line into the “/etc/snmp/snmpd.conf” file:
pass 1.3.6.1.2.1.25.1.9 /bin/sh /usr/local/bin/SNMP-Power-Issues
Restart the SNMP agent with the command:
sudo systemctl restart snmpd
And test the new SNMP parameter with the command:
pi@raspberrypi:~ $ snmpget -c public -v2c localhost 1.3.6.1.2.1.25.1.9
iso.3.6.1.2.1.25.1.9 = Gauge32: 0
Step 6: Monitor Raspberry Pi with Zabbix monitoring tool
Now that you have installed SNMP agent on your Raspberry Pi, it’s time to monitor it with the SNMP manager. Here, I will show you how to do that with the Zabbix monitoring system.
a) Install Zabbix monitoring system
Don’t have Zabbix installed? Don’t worry, I got you covered. You can install Zabbix in 10 minutes. Depending on your operating system (OS) preferences you can follow RHEL, CentOS, Oracle/Alma/Rocky Linux, Ubuntu, Debian, Raspberry Pi (Rasbian) tutorial.
b) Add Raspberry Pi to Zabbix
Go to the “Hosts” menu under the “Monitoring” tab and click the “Create host” option to create a host in Zabbix. Define the name of your Raspberry Pi in the “Host name” field and choose the “Linux SNMP” template for your RPI device under the section “Templates”.
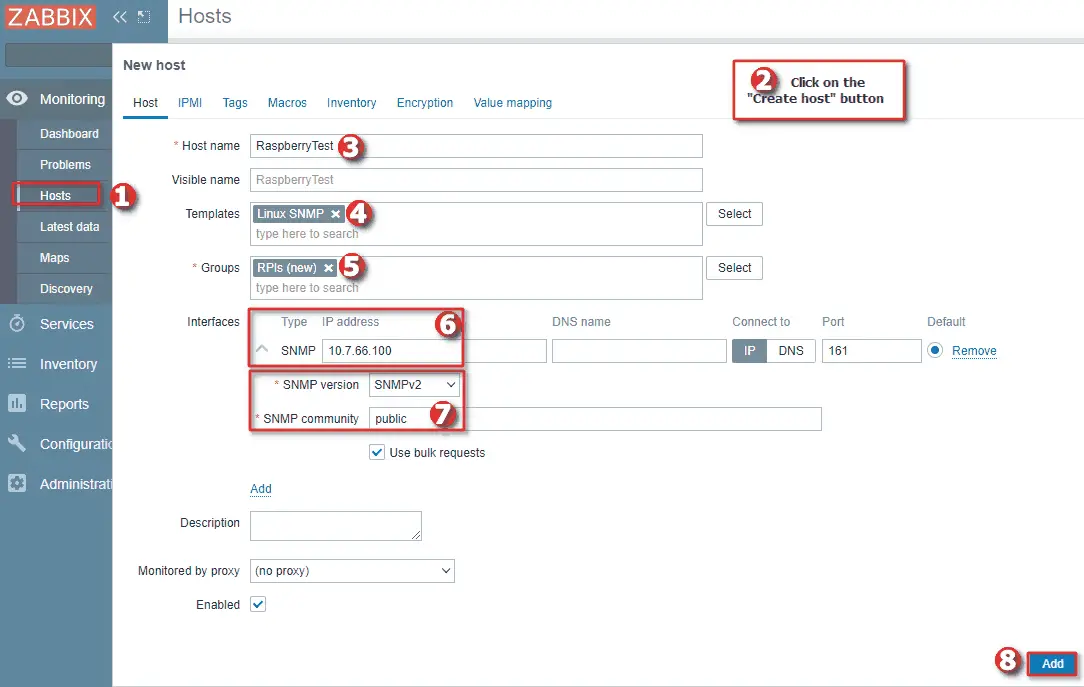
Next, set “Groups” using existing host groups or create a new one. Then add SNMP interface under the “Interfaces” section and set the IP address of the device. And click the “Add” button to add the host to Zabbix.
And you’re done! Nice work!