Even though I’m the Zabbix guy, I must give credit to Cacti. Because if it weren’t for Cacti and its wonderful plugin Weathermap, I probably wouldn’t have ended up in the monitoring field of work.
Cacti was top-notch technology back in 2007 when I started using it, and I must say that Cacti has improved even more over the years and has developed its own cult of followers.
| Name | Links | Licence | Visits / Month | Reviews |
| Zabbix | Wiki, Twitter, Youtube | Free | 750 000 | G2, Capterra, TrustRadius |
| Cacti | Wiki | Free | 70 000 | G2, Capterra |
But how does it stand against Zabbix today? Let’s find out. Zabbix vs Cacti showdown has begun (boxing bell rings!)
Table of Contents
Overview of Zabbix
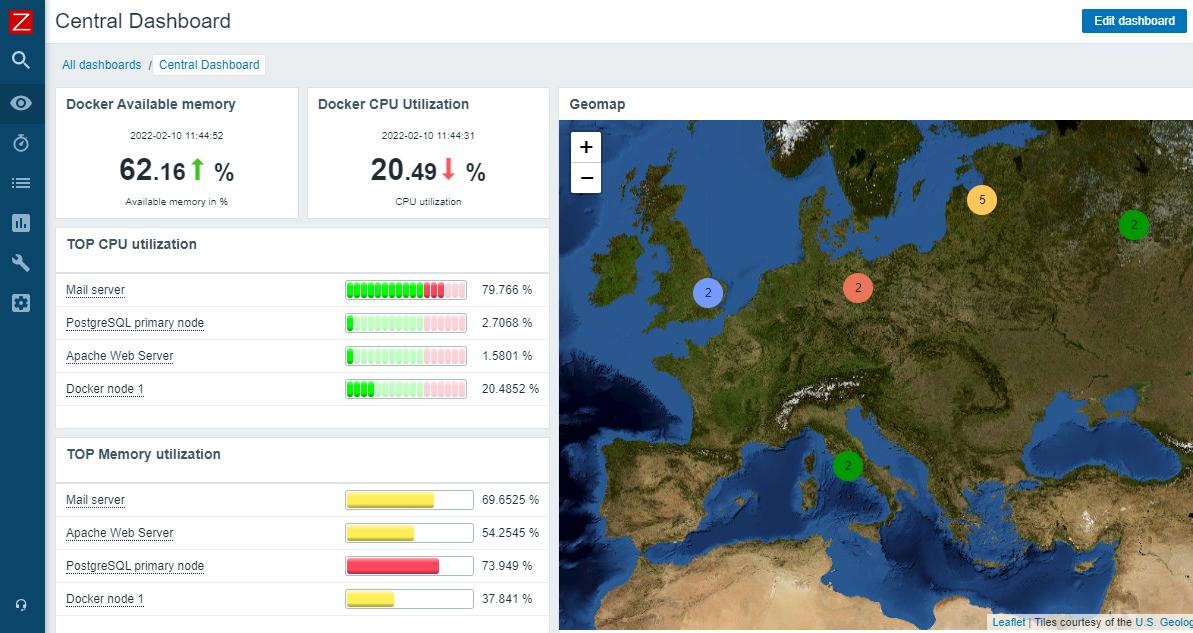
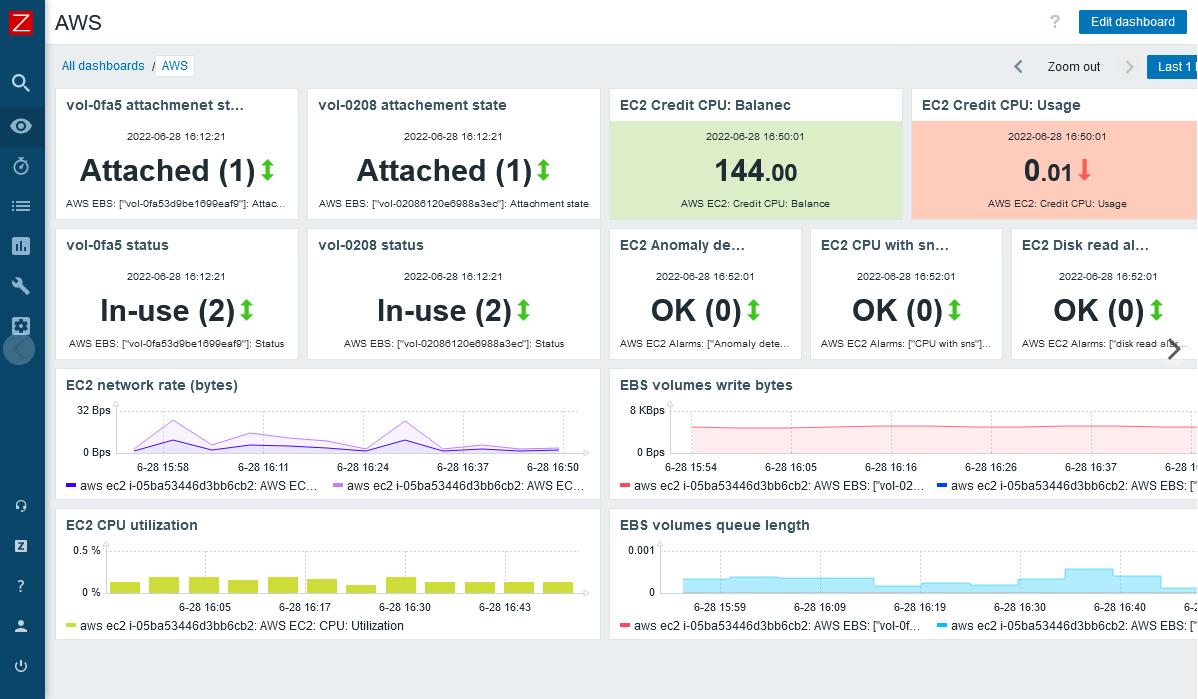
Zabbix has emerged as a robust, open-source monitoring solution trusted by organizations worldwide. Its comprehensive suite of features includes real-time monitoring, alerting, visualization, and capacity planning. With a client-server architecture, Zabbix collects data from various monitored devices and provides insightful metrics through its user-friendly web interface. Zabbix’s flexibility, coupled with a vast library of prebuilt templates, makes it an attractive option for businesses seeking a versatile monitoring tool.
Some of the key features of Zabbix include:
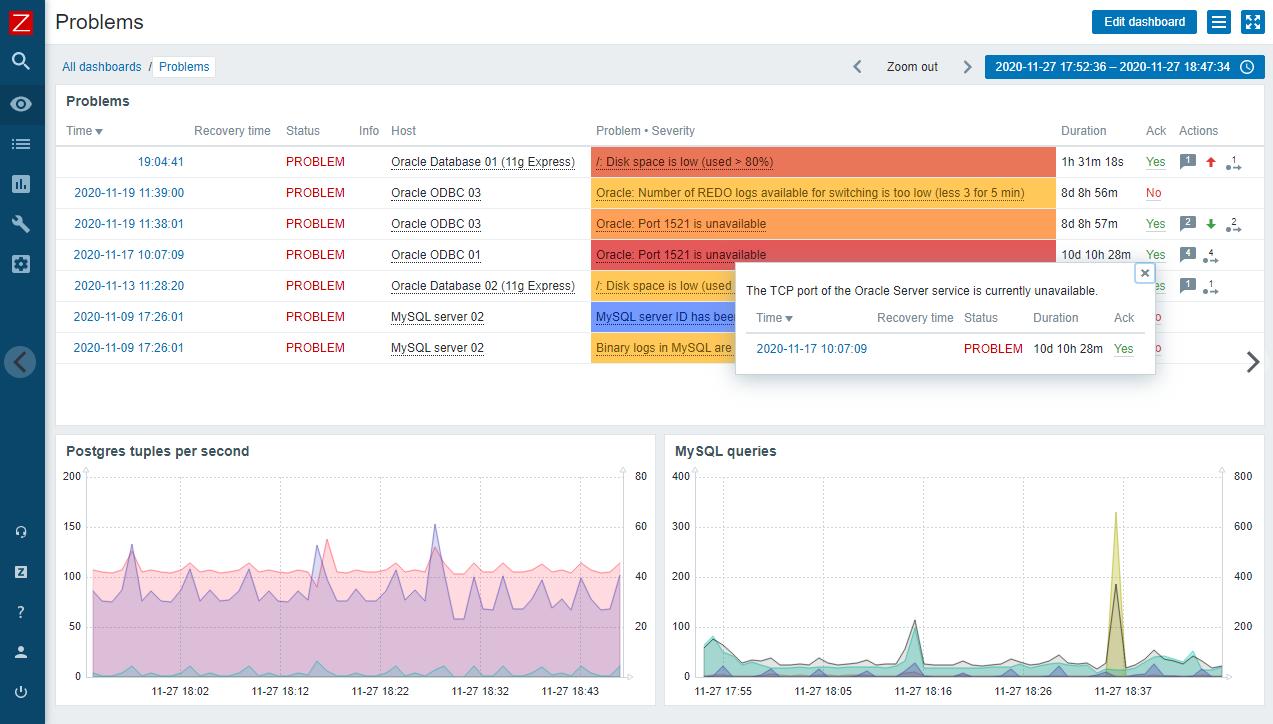
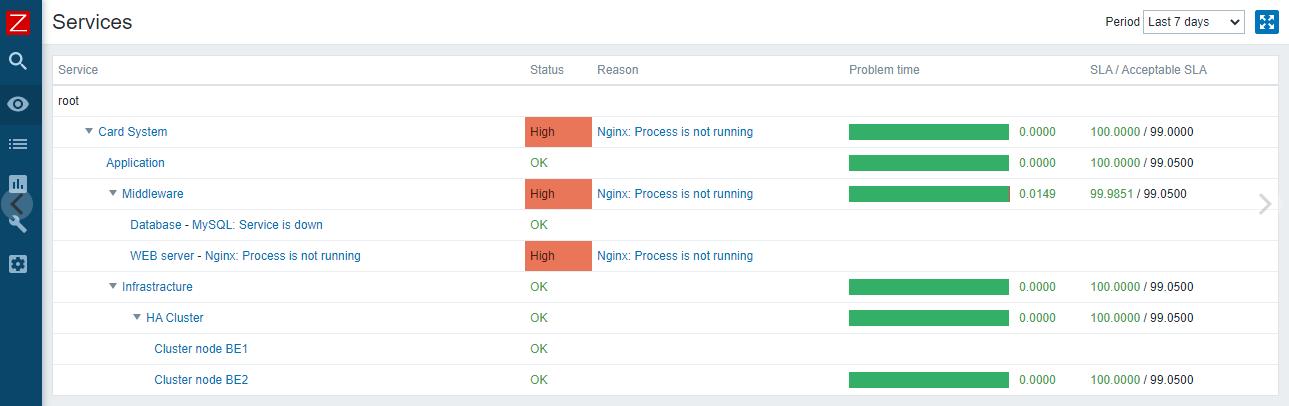
- Alerting: Zabbix has a comprehensive alerting system that can send notifications via email, SMS, or other channels when issues arise. It also supports event correlation, which allows to analyze and filter multiple events, reducing the number of false alarms. Additionally, it has a flexible alerting mechanism that allows to define multiple media types (email, sms, Jabber, etc) and alert scripts.
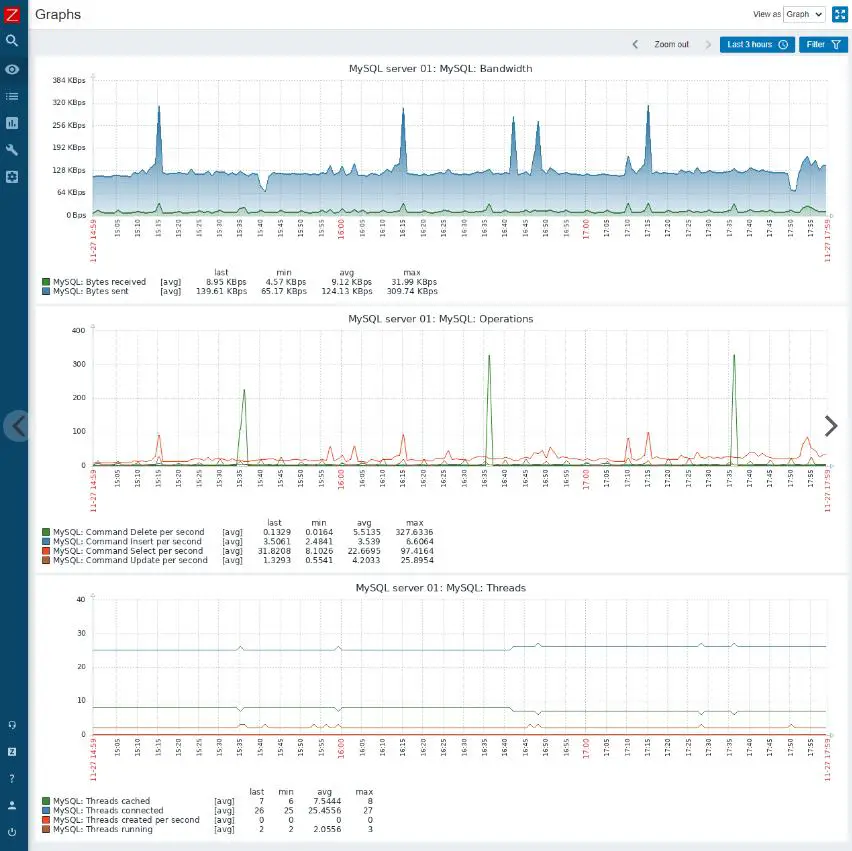
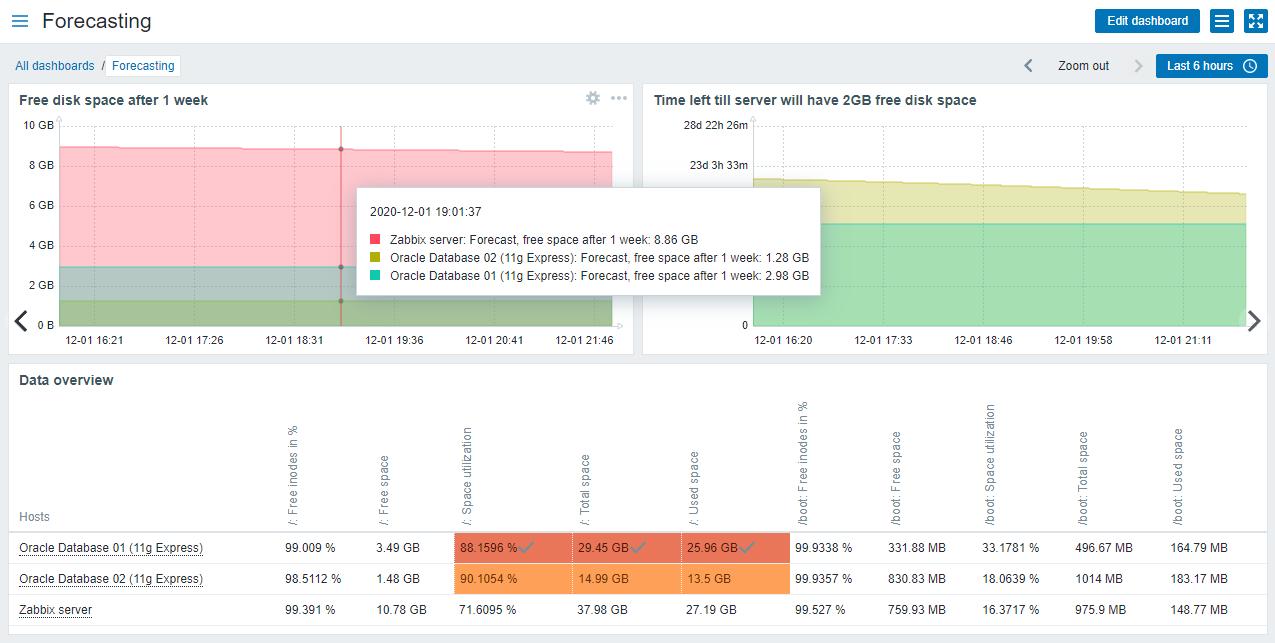
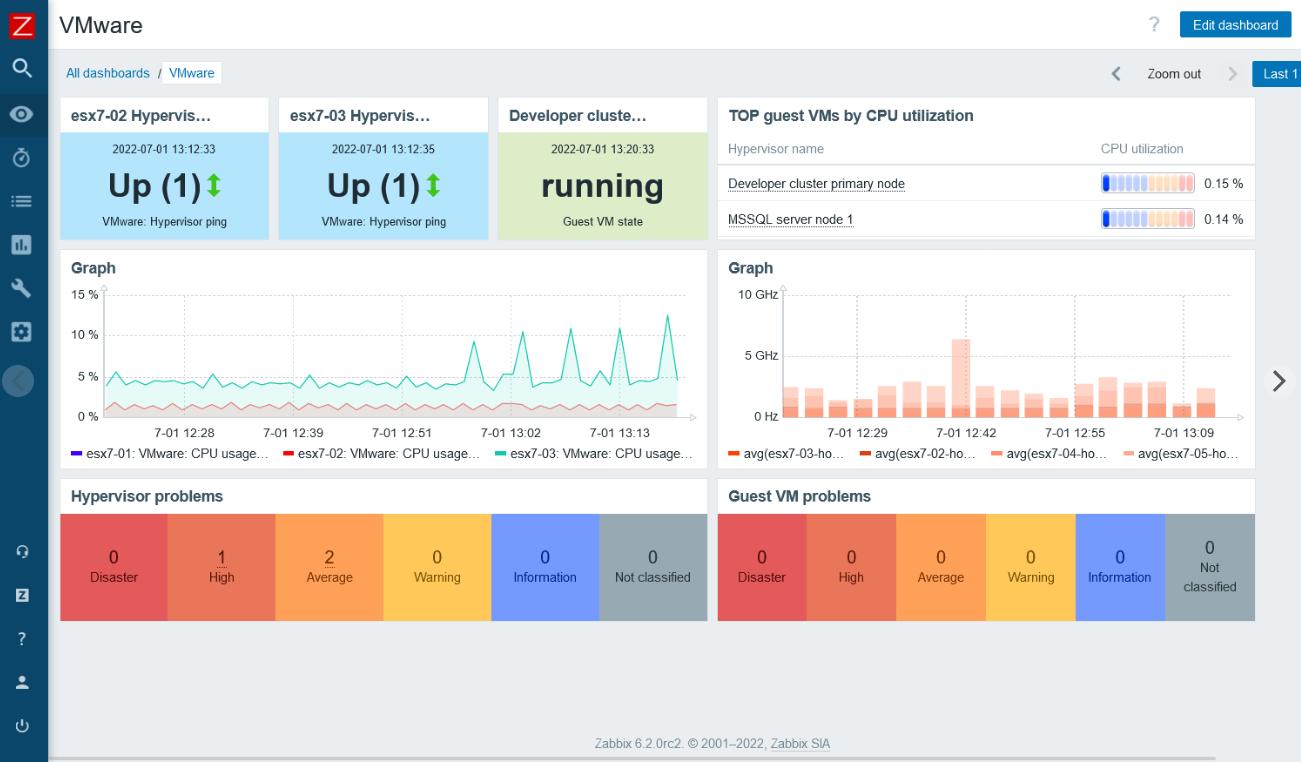
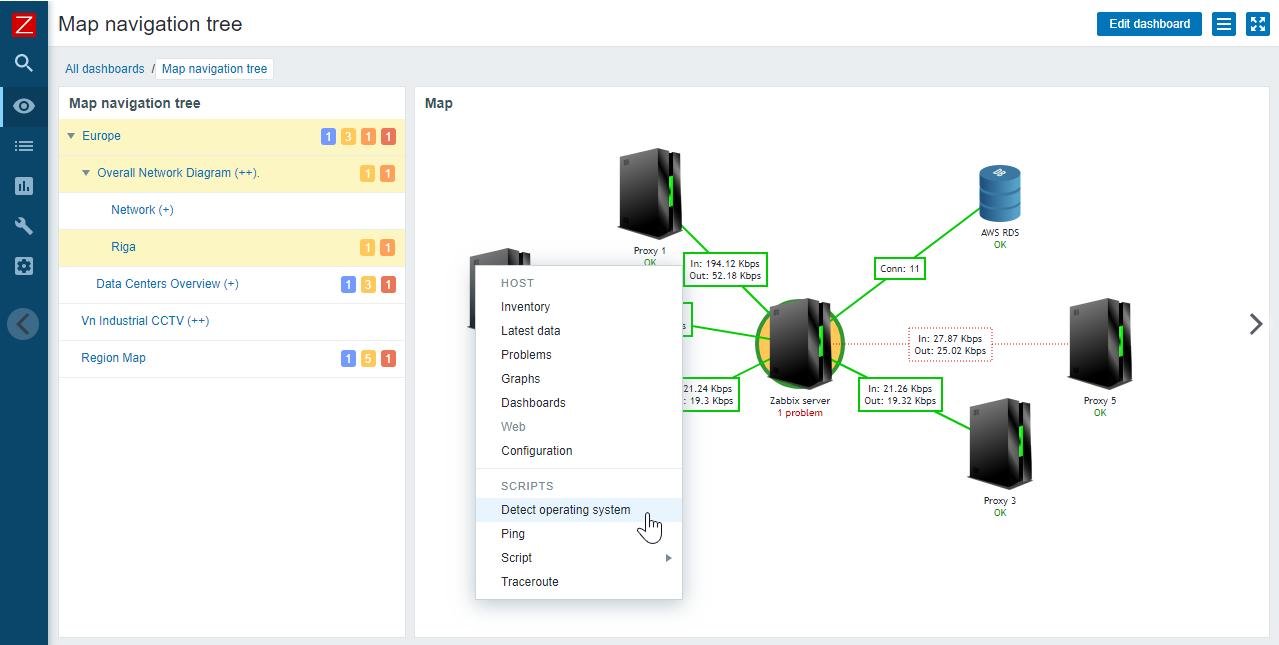
- Visualization: Zabbix provides a variety of options for visualizing data, including graphs, maps, and dashboards. It also has a built-in reporting engine for creating custom reports. Additionally, it supports export and import of data in different formats.. It also supports real-time monitoring, with a web-based dashboard that can be accessed from any device.
- Automation: Zabbix supports automation through the use of scripts and integrations with other tools. This makes it easy to automate tasks such as deploying new servers or scaling infrastructure. It also supports web-hooks which allows to trigger external actions. It also has an API that allows to automate tasks such as creating hosts, items, triggers, etc. Additionally, it supports discovery of network devices and services, automatically creating and updating monitoring items.
- Scalability: Zabbix can handle a large number of hosts and metrics, with a distributed architecture that allows to scale horizontally. It also supports high availability, with active-passive cluster and distributed monitoring.
- Flexibility: Zabbix supports a wide range of operating systems and platforms, including Windows, Linux, MacOS, and more. It also supports a variety of agents such as Zabbix agent, SNMP, JMX, IPMI, etc. Additionally, it supports customization of the frontend, with the ability to create custom screens, maps and dashboards.
- Efficiency: Zabbix is optimized for performance, with a low-overhead architecture and efficient data storage. It also supports data compression and data housekeeping to manage historical data.
- Integration: Zabbix supports integration with a variety of third-party tools, including Nagios, PRTG, and Grafana. It also supports integration with external scripts, like Python, Golang, or Shell. Additionally, it supports integration with cloud platforms such as Amazon AWS, Microsoft Azure, and Google Cloud.
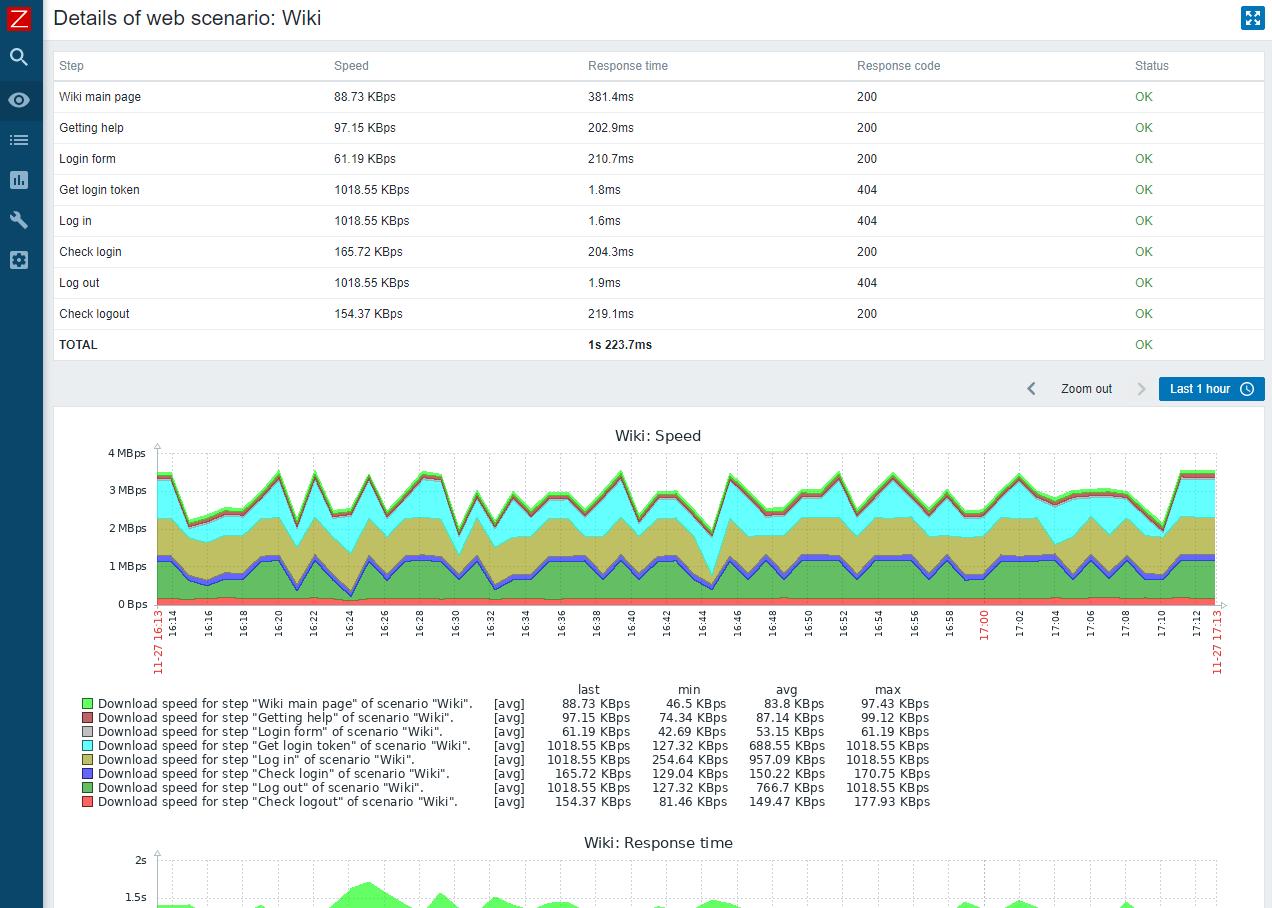
- Extensibility: Zabbix supports the use of custom plugins and scripts, allowing to extend its functionality. It also supports the use of custom alert scripts, allowing to define custom actions based on triggered alerts. Additionally, it supports the use of custom web-scenarios, allowing to define custom checks based on HTTP/HTTPS requests
- AI: Zabbix supports trend prediction, anomaly detection, baselining using statistical algorithms and AI techniques.
Overall, Zabbix is a feature-rich monitoring platform that can be used to monitor a wide range of systems and environments. Its support for alerting, visualization, and automation make it a powerful tool for keeping your IT operations running smoothly.
Read more about Zabbix by reading reviews on top review platforms such as: G2, Capterra, TrustRadius
Overview of Cacti
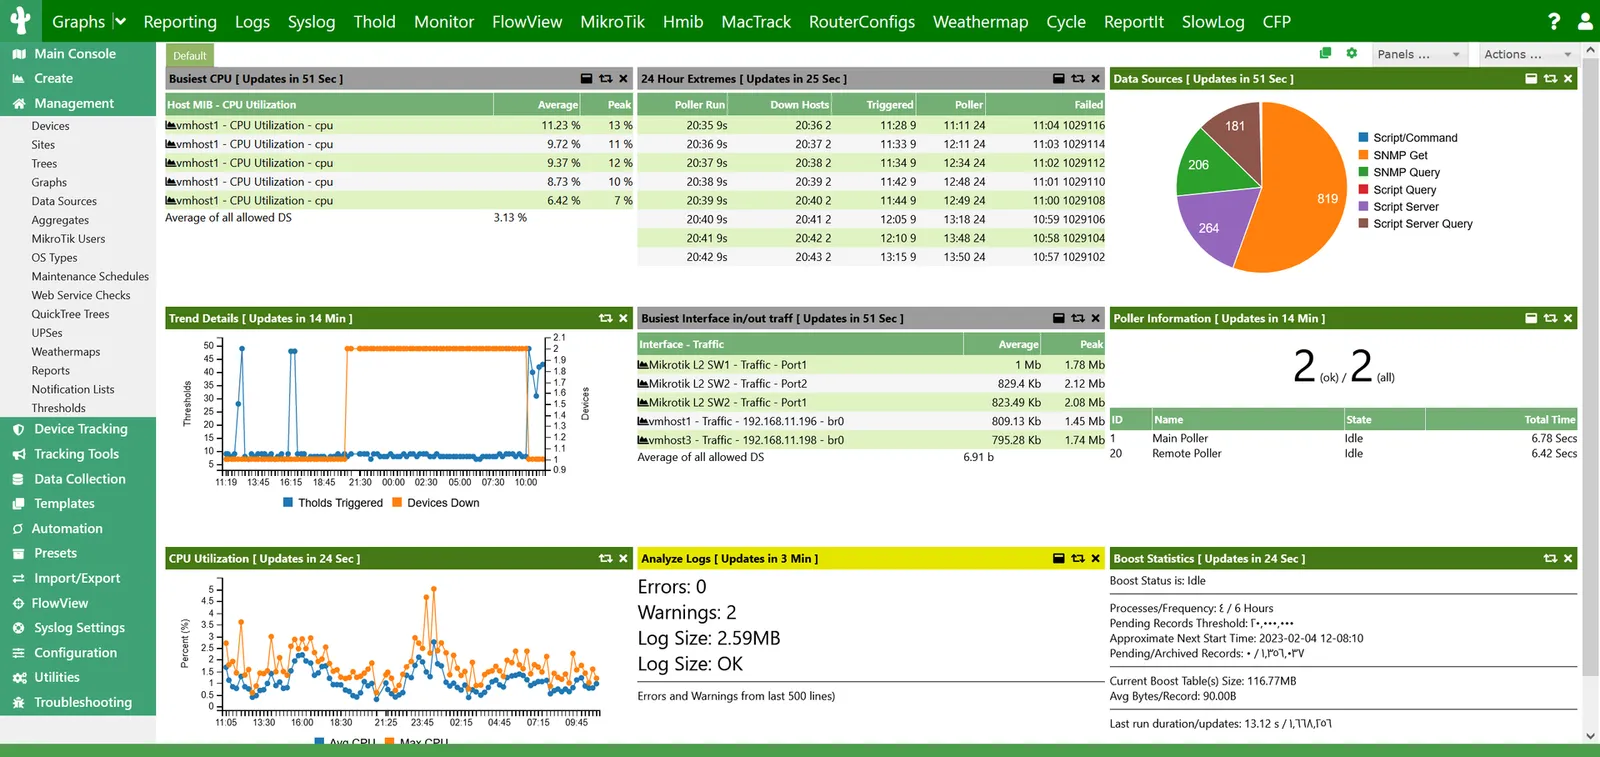
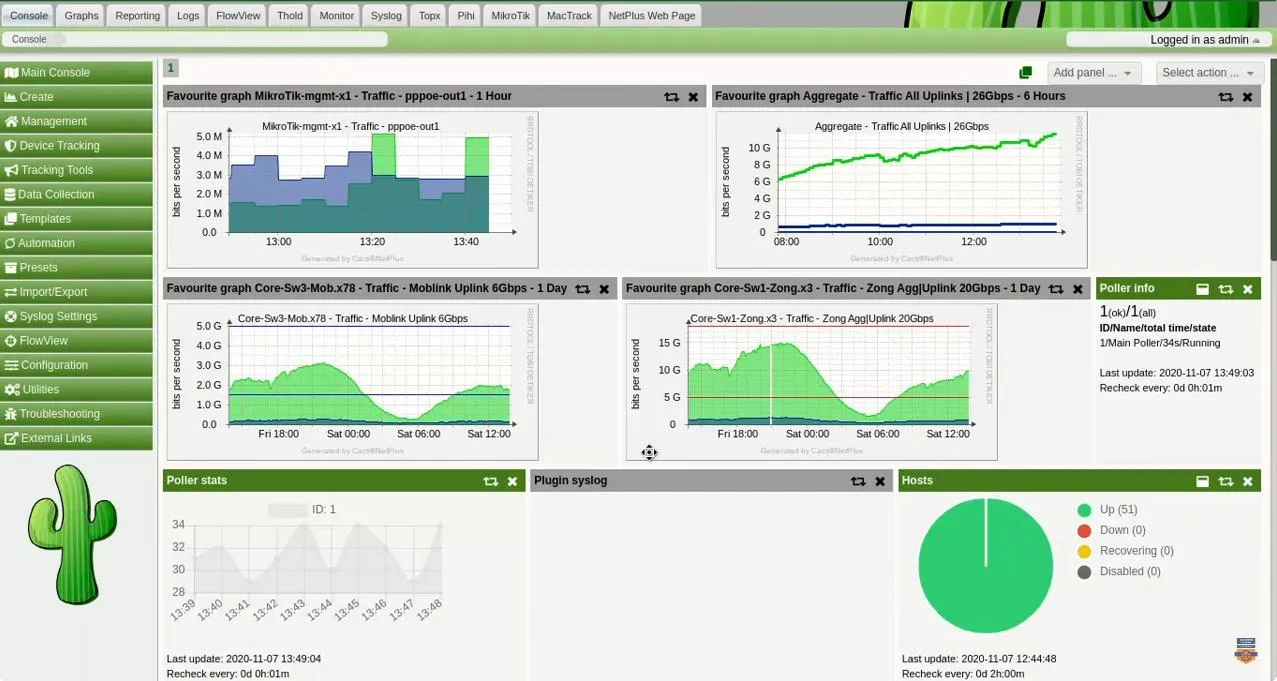
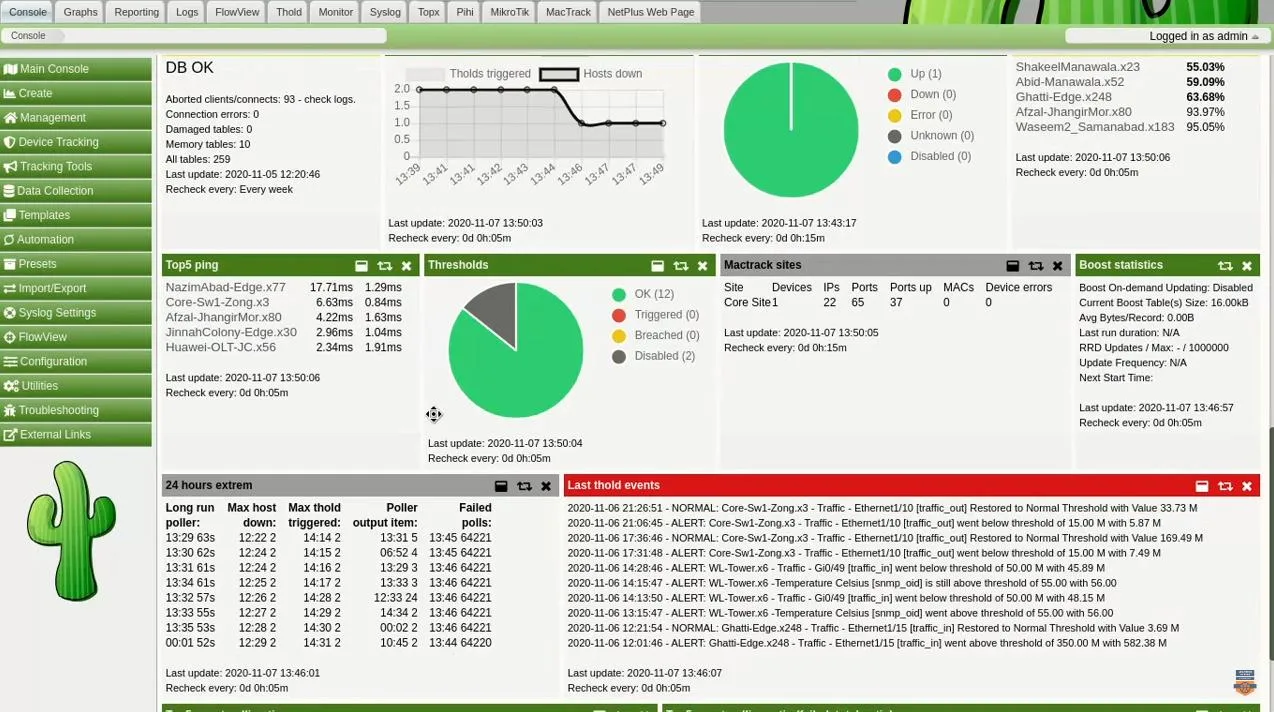
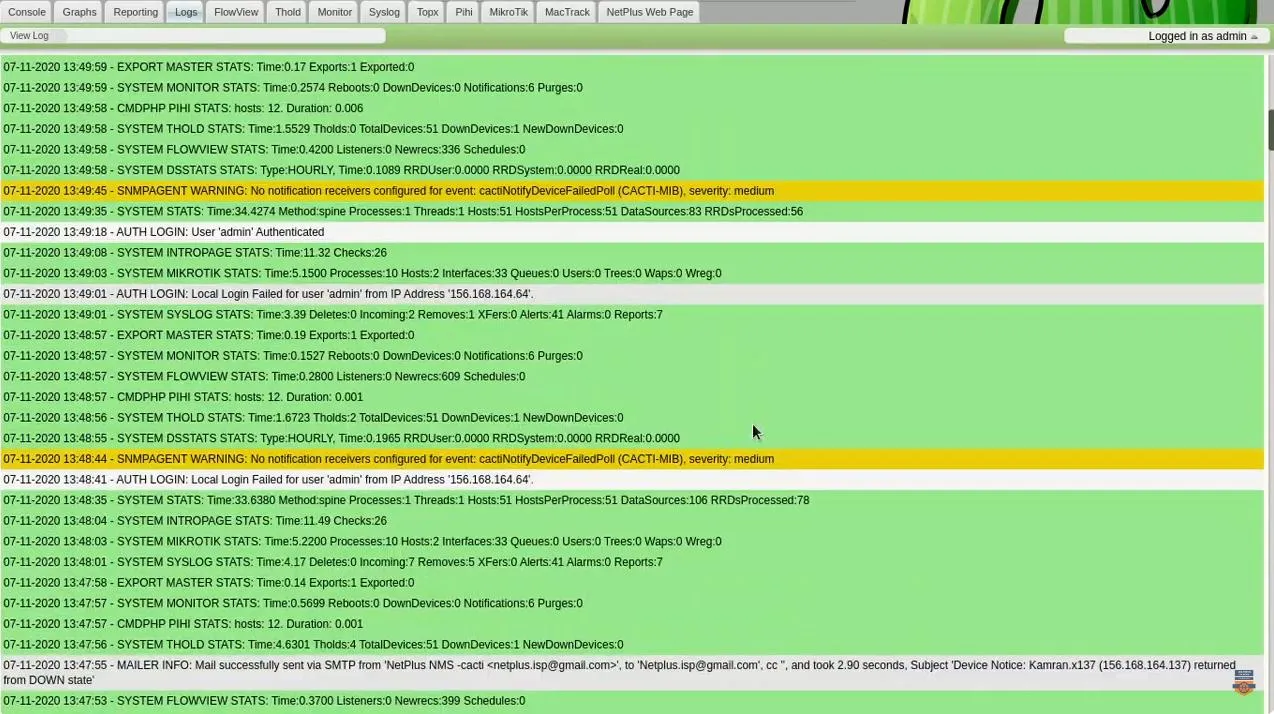
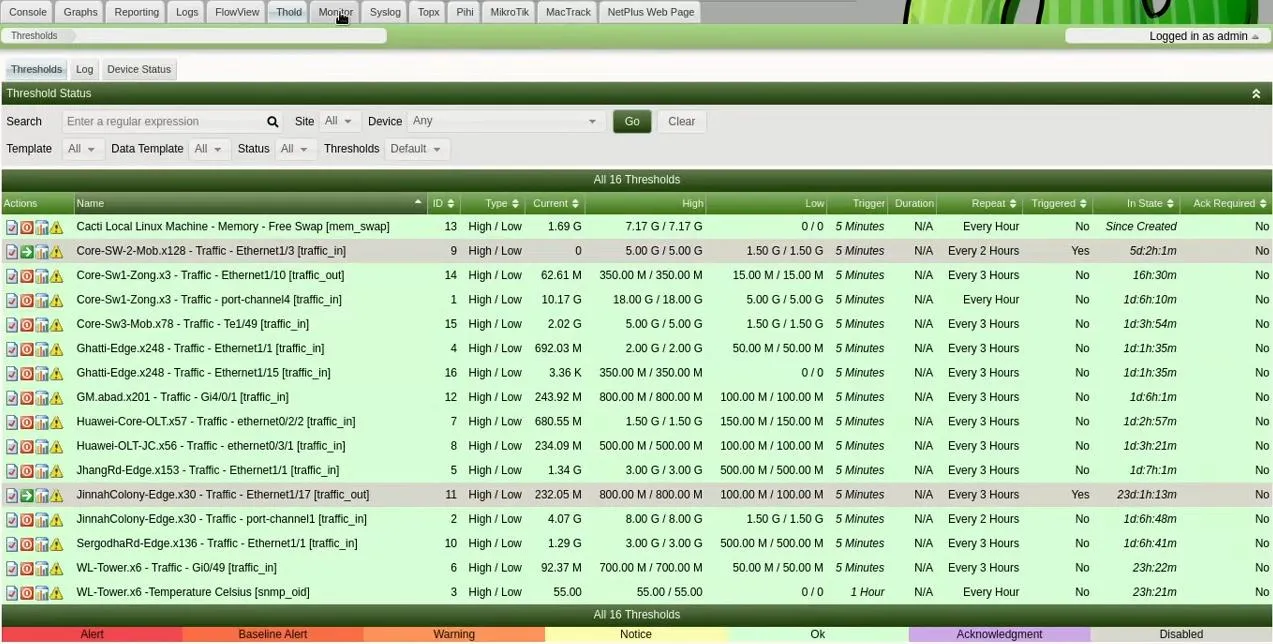
Cacti stands out with its focus on graphing and data visualization. Built on the foundation of the industry-standard SNMP protocol, Cacti excels in generating visual representations of network data trends. Its graph templating system allows users to create custom graphs with ease. Besides Linux, Cacti has extended its support to the Windows operating system, making it even simpler and more user-friendly.
While Cacti might lack some of the advanced features of Zabbix, its simplicity and specialized graphing capabilities make it a go-to choice for those primarily concerned with visual data representation.
Key features of cacti monitoring:
- Device management: Cacti allows you to manage devices, including creating, editing, and deleting devices. You can also associate devices with templates and graphs.
- Data collection: Cacti can collect data from devices using a variety of methods, including SNMP, SSH, and scripts. The data is stored in RRDTool databases.
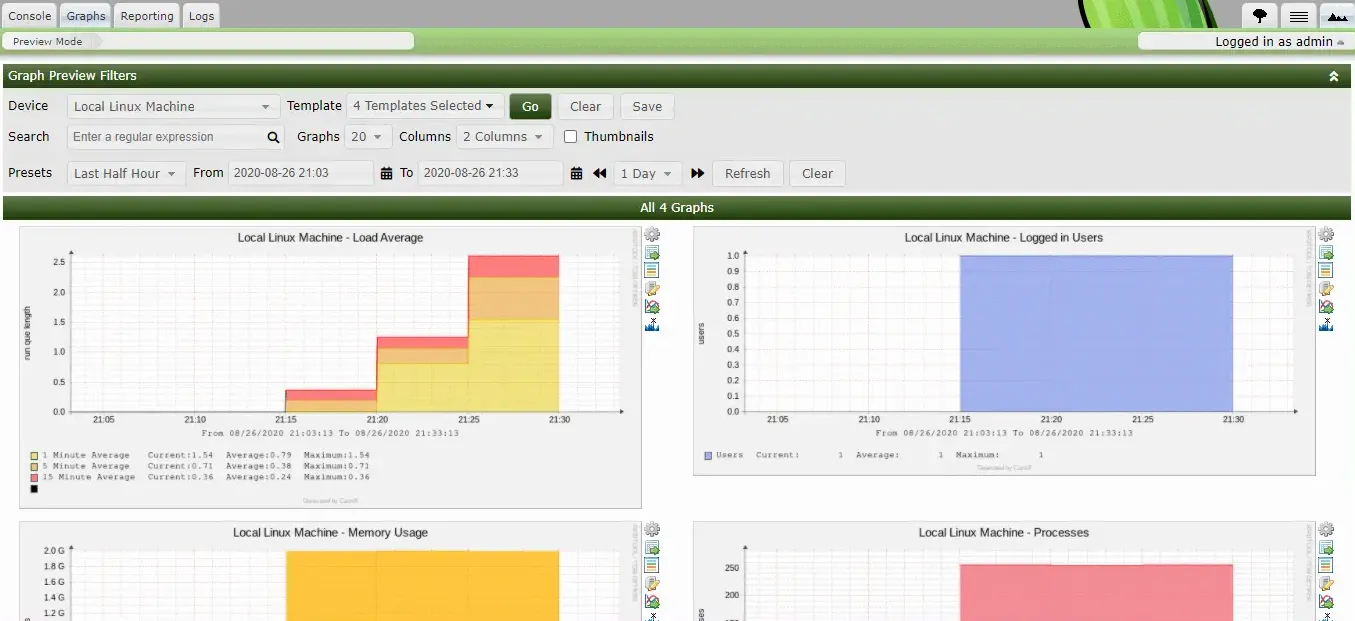
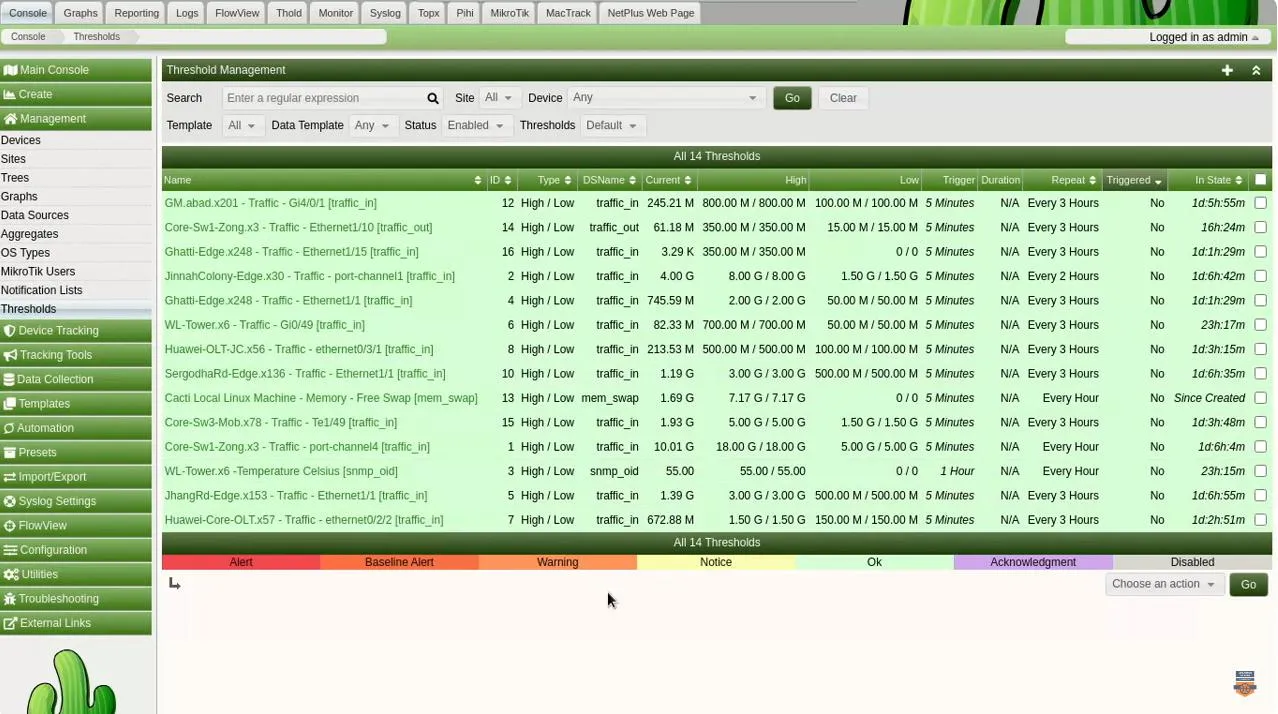
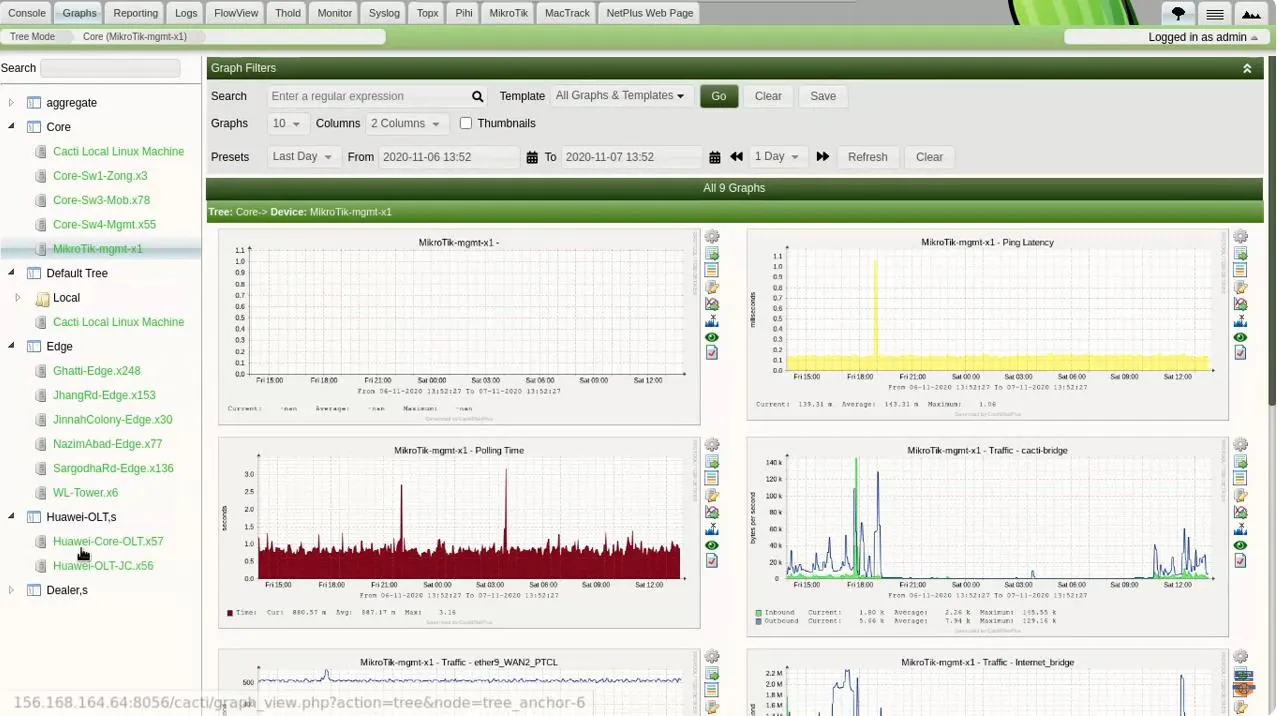
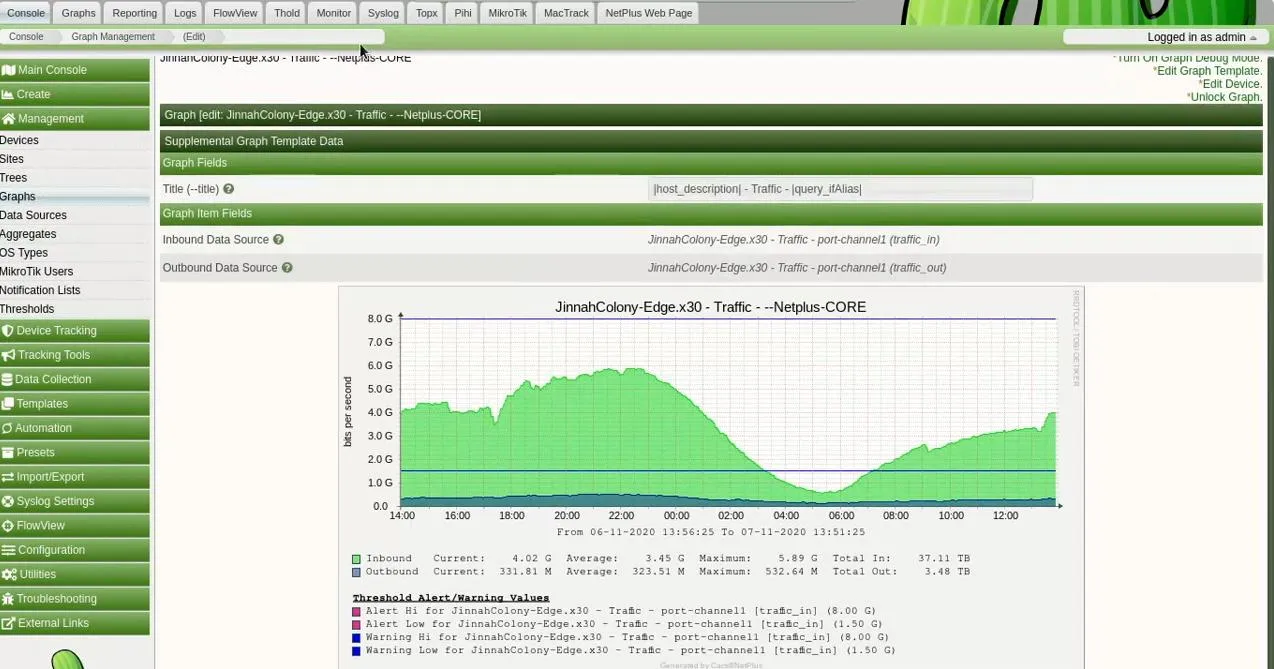
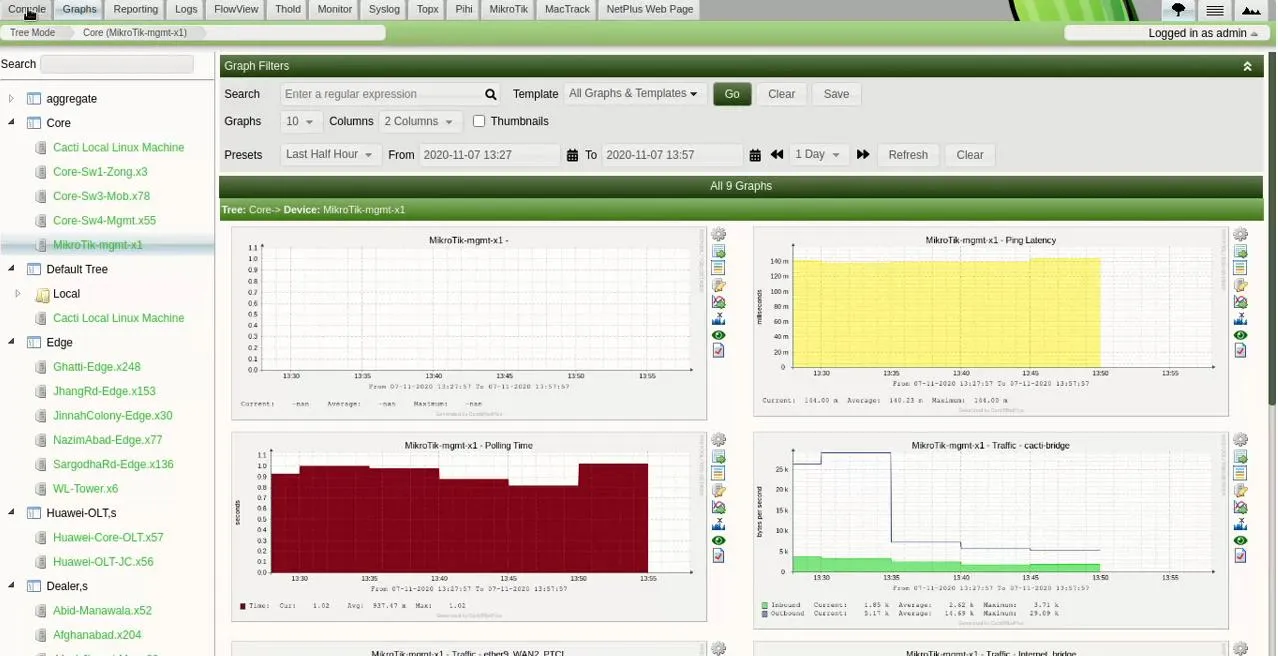
- Graphing: Cacti can create graphs from the data collected from devices. The graphs can be customized in a variety of ways, including the type of graph, the data displayed, and the colors used.
- Templates and packages: Cacti uses templates and packages to help you organize your devices, data sources, and graphs. Templates are pre-configured sets of devices, data sources, and graphs that you can use to quickly create new devices or graphs. Packages are collections of templates and graphs that you can import into Cacti.
- Remote data collection: Cacti can collect data from devices remotely using remote data collectors. This can be useful for monitoring devices that are not located on your local network.
- Discovery and automation: Cacti can automatically discover new devices and create graphs for them. This can save you time and effort.
- User management: Cacti allows you to create users and groups with different permissions. This allows you to control who has access to your data.
- Plugins: Cacti has a plugin architecture that allows you to extend its functionality. There are many plugins available for Cacti, including plugins for monitoring additional protocols, generating reports, and creating custom dashboards.
- Themes, skins, and multiple language support: Cacti allows you to customize the look and feel of its user interface. You can choose from a variety of themes and skins, and you can also translate Cacti into multiple languages.
Cacti is a easy-to-use performance-specialized tool that excels at graphing and efficient data storage. It does this by storing data using the power of RRDTool’s data storage.
Key Differences between Zabbix and Cacti
- Scope and Features: Zabbix offers a wider array of features, including agent-based and agentless monitoring, auto-discovery, and comprehensive alerting. On the other hand, Cacti focuses primarily on graphing and visualization, lacking certain advanced functionalities present in Zabbix.
- Ease of Use: Cacti’s user interface is known for its simplicity, making it an excellent choice for beginners or those who prioritize quick data visualization. Zabbix, while more powerful, might have a steeper learning curve due to its extensive feature set.
- Scalability: Zabbix’s distributed monitoring capabilities make it better suited for large-scale deployments. Cacti, although capable of handling significant data, might face challenges in very complex and expansive network environments.
Use Cases for Zabbix and Cacti
Zabbix shines in scenarios where comprehensive monitoring, alerting, and long-term data retention are critical. Its advanced features make it suitable for medium to large enterprises with complex network infrastructures. Zabbix’s ability to handle a wide variety of devices and protocols further adds to its versatility.
Cacti finds its niche in environments where visual representation of data trends is a priority. It’s an excellent choice for small to medium businesses seeking to visualize network performance and resource usage over time.
Licensing and Pricing
Both Zabbix and Cacti are open-source solutions, meaning you can use and modify them without incurring licensing costs.
Zabbix is open-source software, which means that it is free to use and distribute. However, the company behind Zabbix, Zabbix SIA, also offers paid services, including support, training, and custom development. These services are typically used by larger organizations that need more advanced monitoring capabilities or want to receive support from the Zabbix team.
Cacti is also a 100% free open-source software. However, since there is no company behind Cacti, it might be challenging to find professional services for implementation and support.
Zabbix: Pros and Cons
Pros:
- Comprehensive feature set
- Agent-based and agentless monitoring
- Advanced alerting and notification system
- Active community and extensive documentation
Cons:
- Higher learning curve
- Resource-intensive in large deployments
Cacti: Pros and Cons
Pros:
- Simple and intuitive graphing interface
- Well-suited for small to medium environments
- Lightweight and easy to set up
- More efficient storage of graph data using RRD
- Supported on any operating systems (Linux, Windows, Unix)
Cons:
- Limited advanced features compared to Zabbix
- Might not scale as effectively for complex setups
Conclusion
In the Zabbix vs Cacti showdown, the choice boils down to your specific monitoring needs and the complexity of your network infrastructure.
Zabbix emerges as a robust solution for organizations requiring comprehensive monitoring, alerting, and scalability. On the other hand, Cacti excels at visualizing network data trends in a straightforward manner, making it a valuable asset for smaller setups.
Zabbix is mostly what I implement at customer sites these days. However, I have many good memories about Cacti and its community, so I really don’t have a lot of bad things to say about Cacti. It may lack advanced features, however the ones it offers are exceptionally great, such as graphing and data storage!
It’s also worth pointing out that even though both tools can be installed and configured quickly, Cacti has a smaller learning curve, and as you progress, it presents less complexity.
Evaluate your priorities, infrastructure, and long-term goals to make an informed decision that aligns with your monitoring strategy.