Would you like to learn how to monitor web pages with free and open-source monitoring software called Zabbix? Well then, you are in the right place, because in this tutorial I will show you how to setup web monitoring on Zabbix from scratch using various examples!
Zabbix is not just for website monitoring, it can monitor virtually anything like Linux and Windows servers, VMware platform, Routers, and Switches, Databases, Docker containers, and more. Learn more about Zabbix on the official website.
Web monitoring in Zabbix is a pretty straightforward process. But what if you want to monitor hundreds or more websites in an automated manner? Unfortunately, this cannot be done using the out-of-the-box Zabbix functionality. There is no low-level discovery (LLD) for website monitoring.
However, Zabbix offers tools that can, with a little programming, automatically detect and monitor websites. Don’t worry, you don’t need to write any code, because I will share a template and script that I developed for dynamic website monitoring. With that template, it is enough to give a list of URLs (sitemap link, a path to a text file, macro with URLs separated by a semicolon ), and Zabbix will automatically create web checks for each URL.
But first things first, let me show you how to create a web scenario in Zabbix manually and how to configure alerts that will trigger when your website becomes unavailable.
Table of Contents
- Step 1: Install Zabbix monitoring system
- Step 2: Create a simple Zabbix Web scenario using a template
- Step 3: Enable Website monitoring on the host in Zabbix
- Step 4: Learn how to view web monitoring graphs
- Step 5: Website monitoring with authorization (WordPress example)
- Step 6: Automate web scenario and trigger creation
Step 1: Install Zabbix monitoring system
Don’t have Zabbix installed? Don’t worry, I got you covered. You can install Zabbix in 10 minutes. Depending on your operating system (OS) preferences you can follow CentOS/RHEL, Ubuntu, Debian, Raspberry Pi OS (Rasbian) tutorial.
Zabbix installed and ready? Then, continue with the tutorial.
Step 2: Create a simple Zabbix Web scenario using a template
Web scenario is a key mechanism that enables web monitoring in Zabbix. A web scenario consists of one or more steps (HTTP requests) that are periodically executed in a predefined order.
You can create web scripts directly on the host, but this is not the best practice. It is better to create web scenarios in the template and then link them to the host. Let me show you how it’s done!
a) Create a Zabbix template for website monitoring
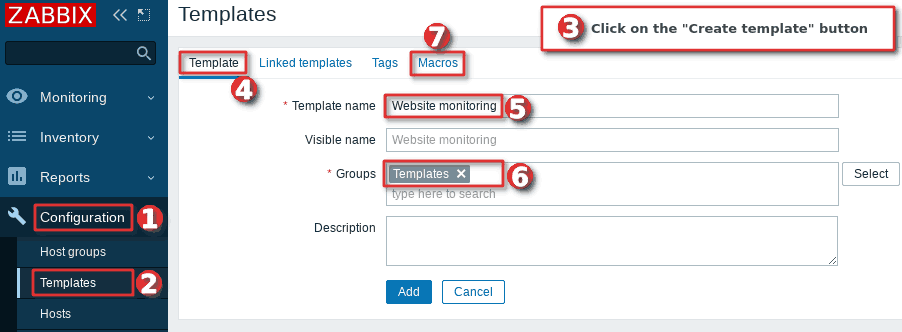
Navigate to the “Templates” under the “Configuration” section and click on the “Create template” button. Under the “Template” tab you need to define the “Template name” and the host group – “Groups“.
Next, switch to the “Macros” tab and create the macro {$WEB.URL}, but leave the value field blank for now. You will define a URL in that field later when you link the template with a host.
NOTE: You will later set the URL of the website you want to monitor in the {$WEB.URL} macro. And wherever that macro is used in the template, it will be translated into that URL. That way, you can use one template on multiple hosts and monitor different websites without changing the template.
Nice! Click the “Add” button to create the template and move to the next step.
b) Create a web scenario in the template
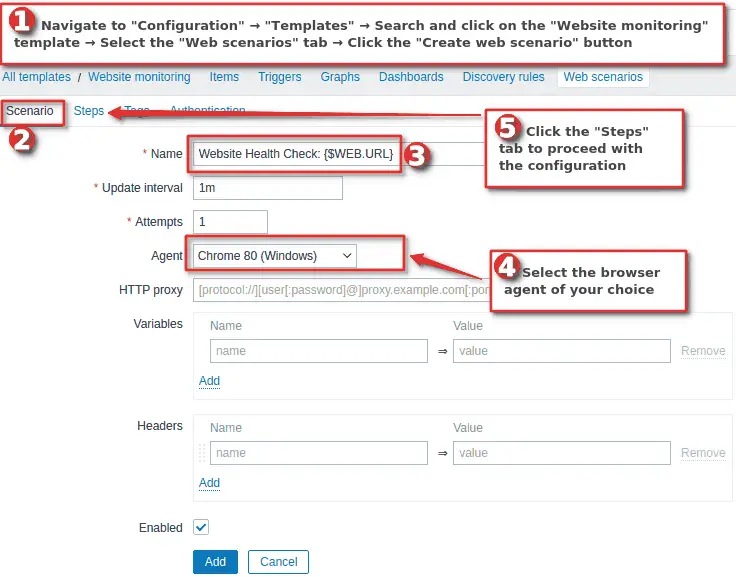
Now, go to the newly created template and click the “Create web scenario” button under the”Web scenarios” tab. Set name to “Website Health Check: {$WEB.URL}” and select the browser agent of your choice under the “Agent” dropdown.
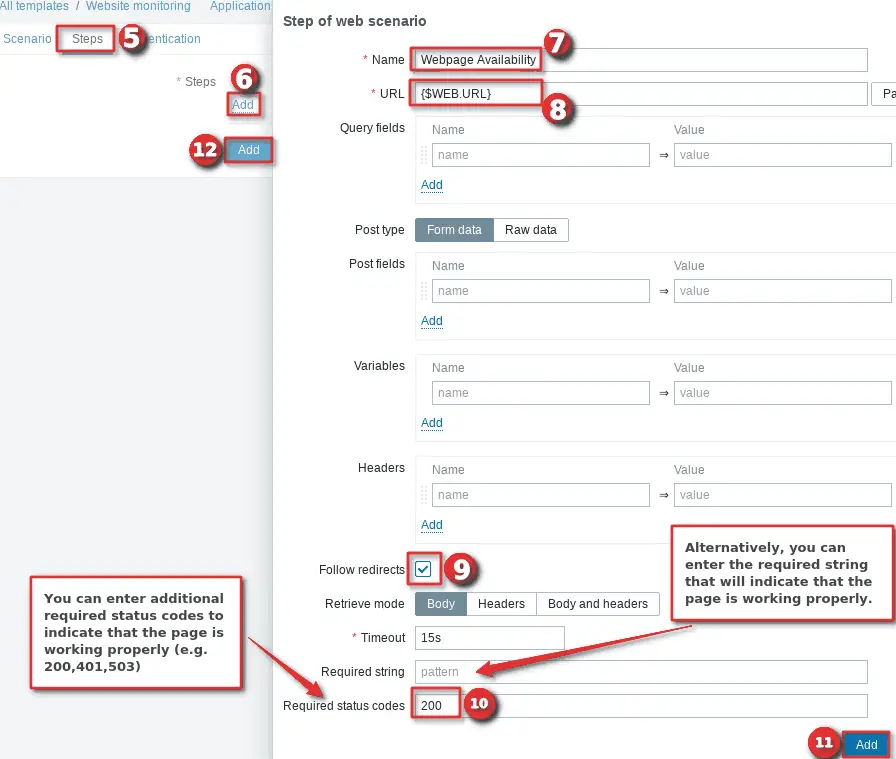
After that switch to the “Steps” tab and click on the little “Add” button to create your first step. A new window will appear in which you need to set the “Name” to “Website Availability“, “URL” to “{$WEB.URL}“, enable “Follow redirects“, and “Required status codes” to “200“. Basically, we are telling Zabbix that it must get code 200 if the page is working properly.
Now click that big “Add” button to create a step. And after the window closes, click the second “Add” button to create the web scenario.
And you’re done! You have created your first web scenario! Nice work!
Note that you can enter additional required status codes (comma separated) that will indicate that the page is working properly. In addition to the status code 200, I like to add 401, 403, 410, and 503 codes. Learn more about status codes on the IANA or Wikipedia.
| HTTP Status Codes | Description |
| 200 | OK – standard response for successful HTTP requests |
| 401 | Unauthorized – user does not have valid authentication credentials for the target resource |
| 403 | Forbidden – request contained valid data but does’t have the necessary permissions for a resource |
| 410 | Gone – indicates that the resource requested is no longer available and will not be available again (removed by the administrator). |
| 503 | Service Unavailable – usually this code is used to indicate that the website is down for maintenance |
c) Create a trigger (alarm) for the web scenario
If you want to receive notifications when your site is unavailable or slowing down, then you need to create Zabbix triggers. To do this, you need to update our Website Monitoring template by adding a new trigger.
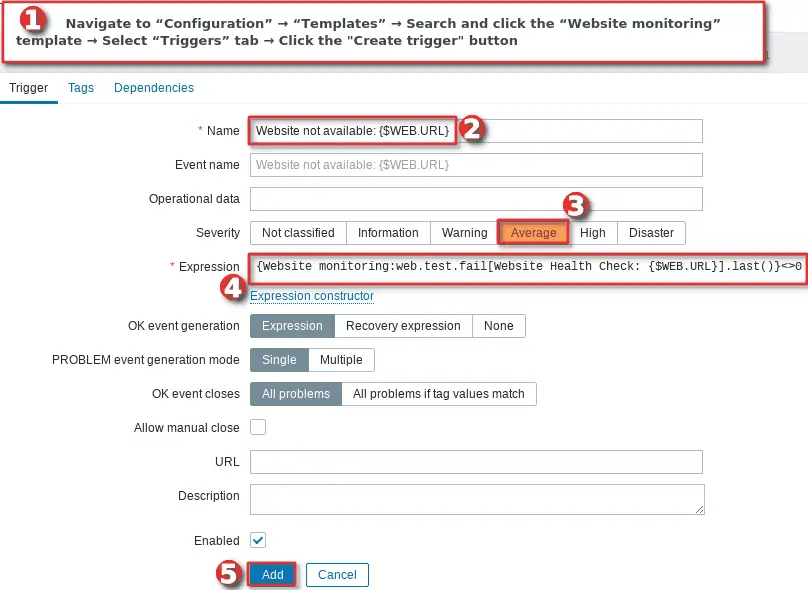
First, we will create a trigger that will check website availability every minute. Navigate to the “Configuration” → “Templates” → search and click the “Website monitoring” template → select the “Triggers” tab → click the “Create trigger” button.
Set trigger name to:
Website not available: "{$WEB.URL}"
Severity can be whatever you prefer. Add trigger expression using that little “Add” or manually as a text using this expression:
New syntax expression
last(/Website monitoring/web.test.fail[Website Health Check: {$WEB.URL}])<>0
Old syntax expression (Zabbix 5.2 and older)
{Website monitoring:web.test.fail[Website Health Check: {$WEB.URL}].last()}<>0
Note that you can replace the “last()” function with the “min(5m)” function if you would like to receive a notification only when the website is down for more than 5 minutes. Alarms can be spammy sometimes when using the “last” function so consider using “avg“, “max” or “min” functions (hysteresis).
Click that big “Add” button when you’re done configuring the trigger and you are done!
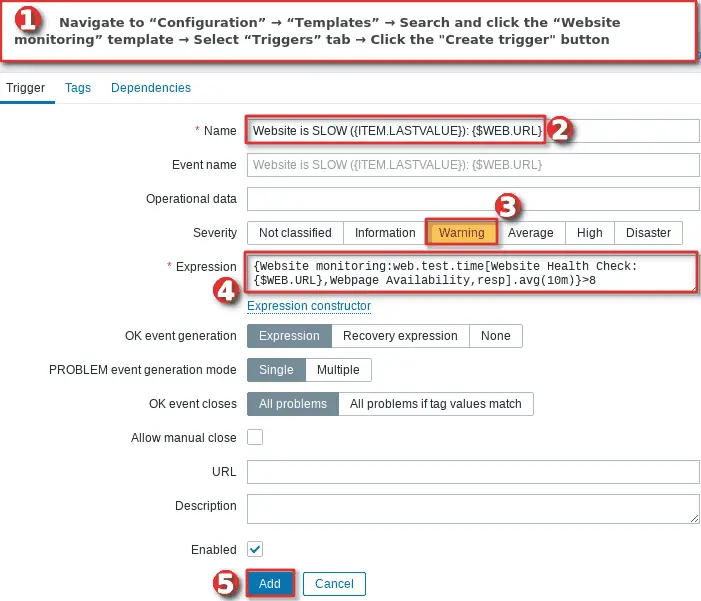
The previous trigger will alert you if our website is unavailable, but what if it is available but very very slow? We need another trigger that will alert us to such a problem. Let’s create that trigger! Just repeat the same procedure: navigate to “Configuration” → “Templates” → Search and click the “Website monitoring” template → Select “Triggers” tab → Click the “Create trigger” button.
Set trigger name to:
Website is SLOW ({ITEM.LASTVALUE}): {$WEB.URL}
Severity can be whatever you prefer. Add trigger expression using that little “Add” or manually as a text using this expression:
New syntax expression
avg(/Website monitoring/web.test.time[Website Health Check: {$WEB.URL},Webpage Availability,resp],10m)>8

Old syntax expression (Zabbix 5.2 and older)
{Website monitoring:web.test.time[Website Health Check: {$WEB.URL},Webpage Availability,resp].avg(10m)}>8
Click that big “Add” button when you’re done configuring the trigger and thats it!
NOTE: Consider creating a new macro {$URL.SPEED} on the template and replacing 8 seconds with {$URL.SPEED} in trigger expression. This will be useful if you are planning to change that threshold often or if you have multiple sites with drastically different response times.
Step 3: Enable Website monitoring on the host in Zabbix
Well done! You created a simple web scenario in Zabbix using a template! Now you need to enable website monitoring by linking that template with the host and defining a URL within the macro!
As you may have noticed we are still not monitoring anything! Because we didn’t link the template to the host! Let’s do that!
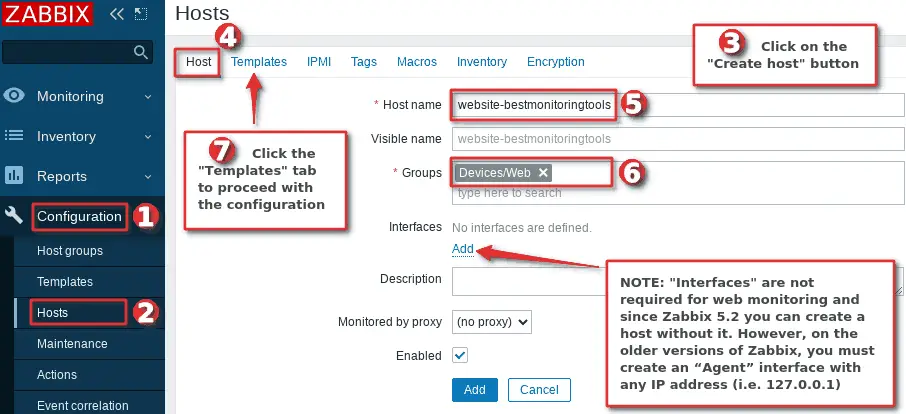
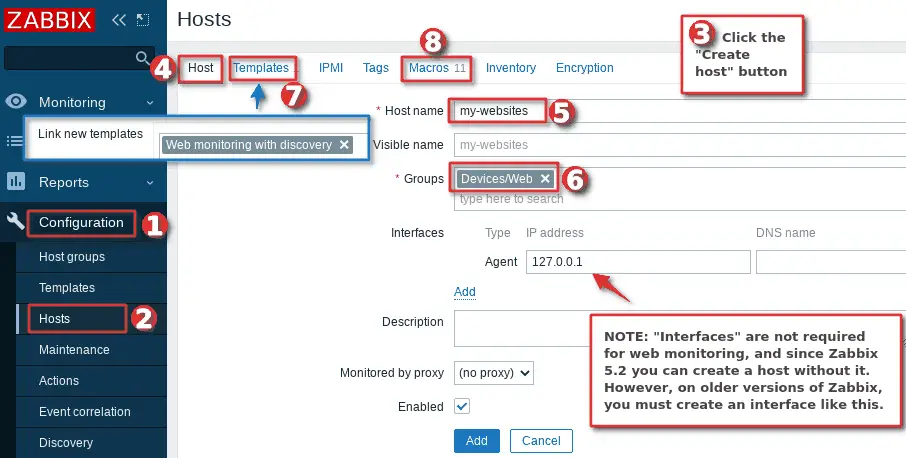
Navigate to the “Host” menu under the “Configuration” section and then click the “Create host” option to create a host in Zabbix. Define “Host name”, set something that will describe what you are monitoring. Create your group using the “Groups” field or use an existing one.
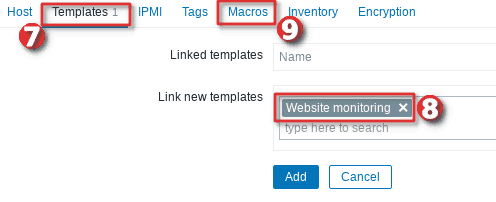
Don’t click that “Add” button yet! We need to link a template that we created in the previous step and configure {$WEB.URL} macro. Click the “Templates” tab and link the “Website monitoring” template using the “Link new templates” field.
Switch to the “Macros” tab , click the “Change” for the macro “{$WEB.URL}” and set the URL of the website that you need to monitor in the value field of that macro.
Press that add button and you’re done!
Step 4: Learn how to view web monitoring graphs
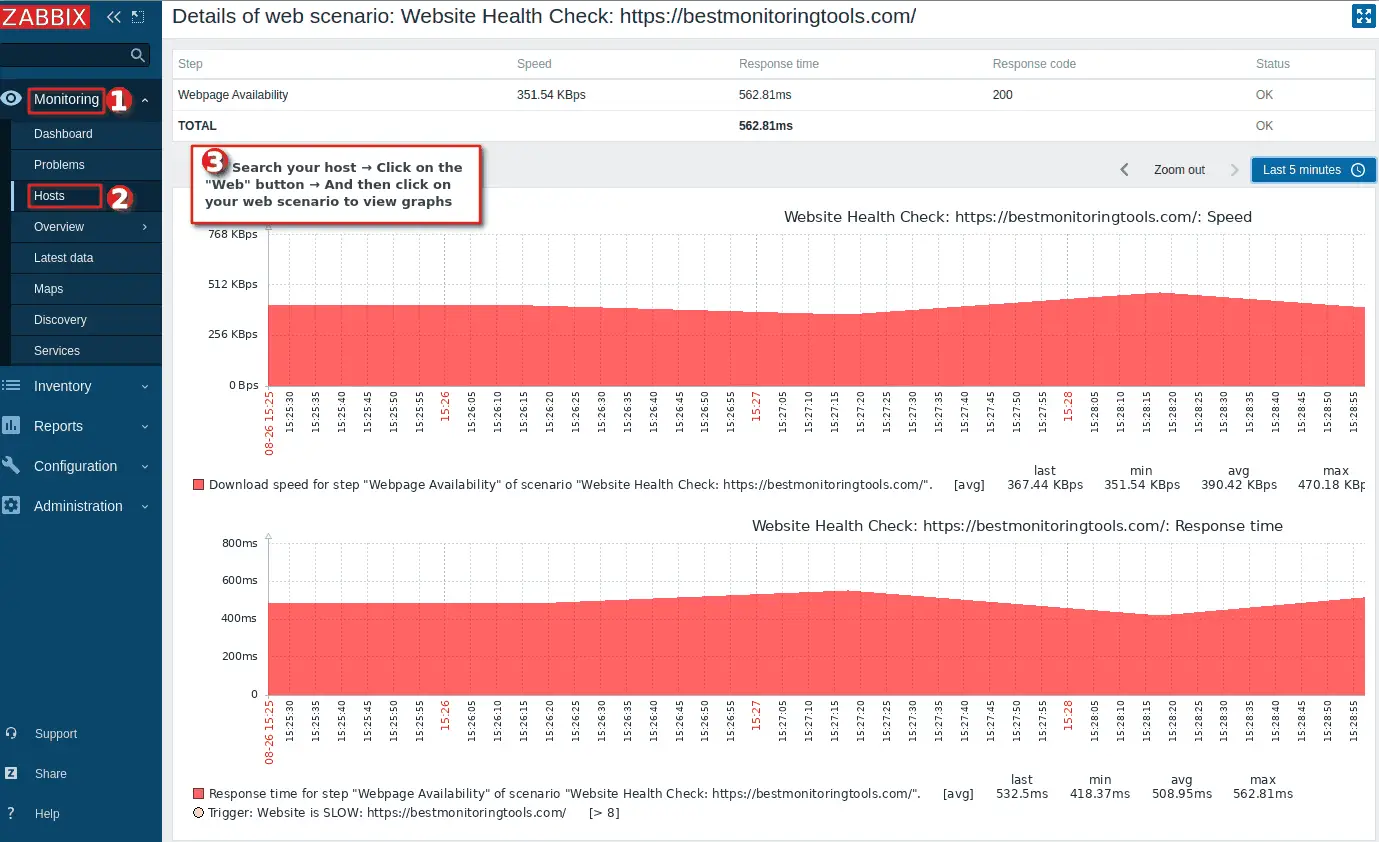
There are several ways to visualize data on Zabbix, but to simplify things, let’s see the default visualization for web scenarios. Navigate to “Monitoring” → “Hosts” → Search your host → Click on the “Web” button → and then click on your web scenario to view graphs.
That’s it! Nice work!
CONGRATULATIONS!
You have successfully configured Web Monitoring in Zabbix!
No need to change anything else as other steps are optional.
CONTINUE TO LEARN MORE:
Configure Website monitoring with authorization
Automate web scenario and trigger creation
In the previous step, we have configured a simple web scenario that checks the unavailability or slowness of the website. And most of the time that’s all you’ll ever need. However, what if we want to test user authentication on the website? Well, we can configure that on Zabbix, and even more!
Let’s create a multi-step web scenario that will sign in to the website using credentials, click on the profile page, log out, and notify us if any of these steps fail.
We will use this WordPress blog as a example.
a ) Search for post fields in the login form
Before we continue, it is crucial to find out which post fields we need to use to successfully log in to the website using Zabbix. If you are also monitoring a WordPress website then you can skip this step because I have dug up all the post fileds for you.
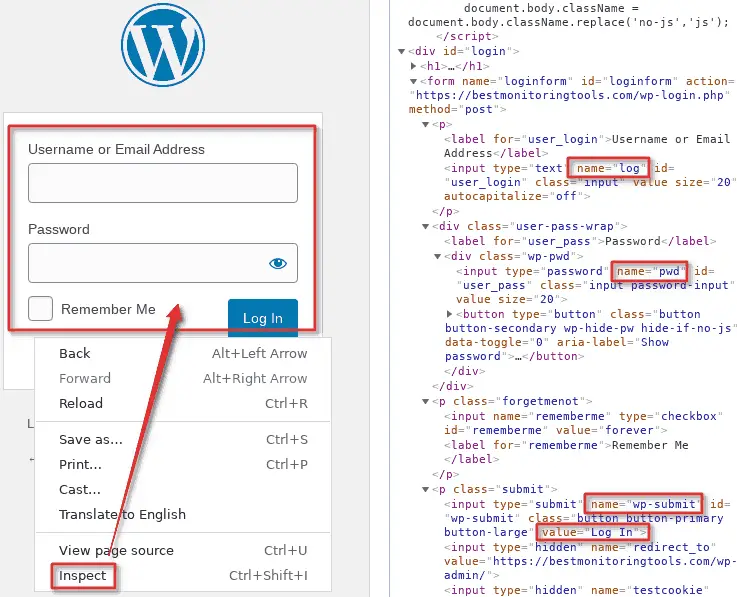
However, if you want to know to extract post fields from the login form, then check out the instructions in the image below.
Basically, you need to use Chrome or Firefox inspect tool to find out user, password, and submit post fields:
| Post field Name | Post field Value |
| log | <website username> |
| pwd | <website password> |
| wp-submit | Log in |
Creating web scenarios directly on the host is a bad practice so we will use a template.
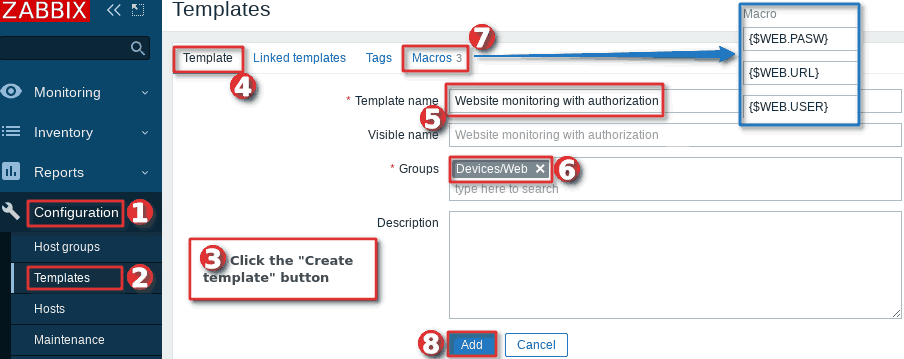
Navigate to the “Templates” under the “Configuration” section and click on the “Create template” button. Under the “Template” tab you need to define the “Template name” and the host group under the “Groups” field. I will set the name to “Website monitoring with authorization” and “Groups” to “Devices/Web“.
Next, switch to the “Macros” tab and create macros: {$WEB.URL}, {$WEB.PASW}, and {$WEB.USER}, but leave the value fields blank for now. You will define a URL, username, and password values later when you link this template with a host.
Click the “Create template” button and proceed to the next step.
c ) Create multi-step web scenario on the Zabbix template
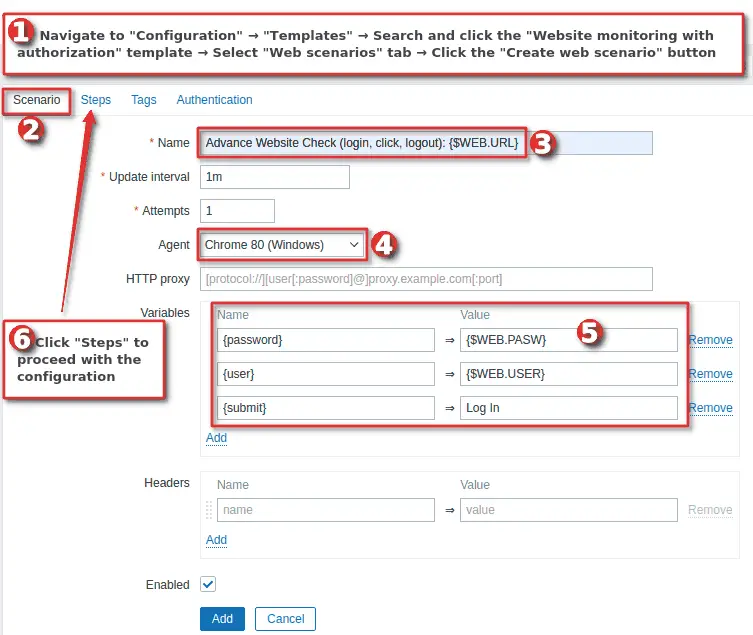
Now, go to the newly created template and click the “Create web scenario” button under the”Web scenarios” tab. Set name to “AdvanceWebsite Check (login, click, logout): {$WEB.URL}” and select the browser agent of your choice under the “Agent” dropdown.
Since we are creating multiple web scenarios then it would be wise to set variables for username, password, and submit values. In this way, we can use these variables in as many steps as we want. In our case, we plan to define username and password later using macros so we will set macros instead of real credentials:
| Variable Name | Variable Value |
| {password} | {$WEB.PASW} |
| {user} | {$WEB.USER} |
| {submit} | Log In |
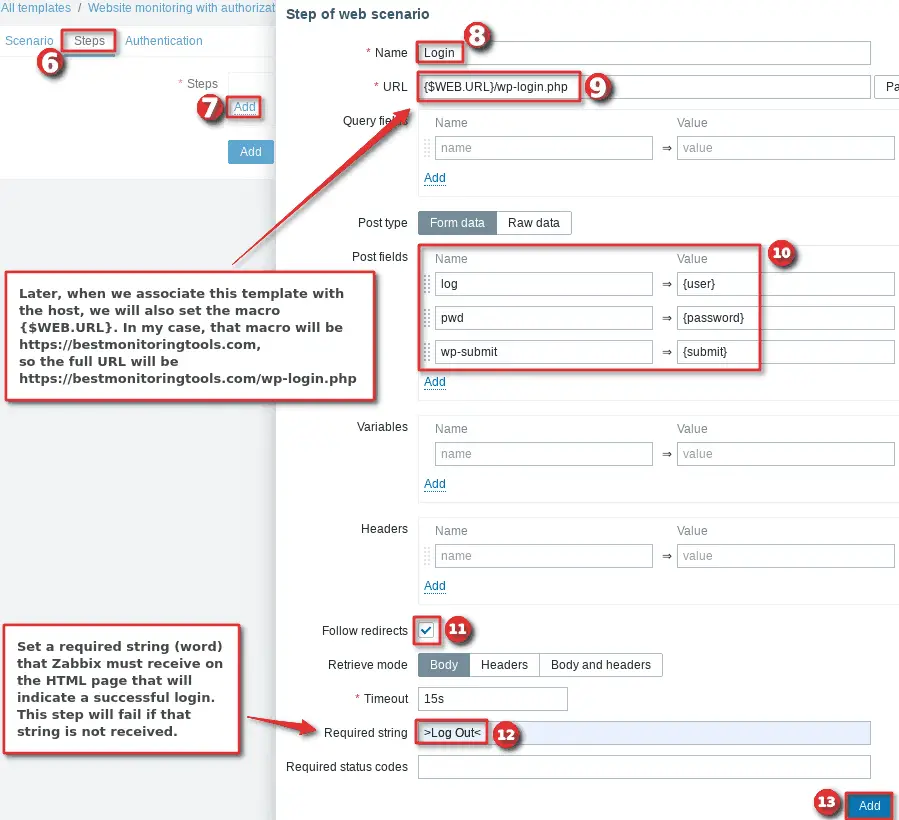
Web scenario step 1: Create “Login” web scenario
After that switch to the “Steps” tab and click on the little “Add” button to create your first step. A new window will appear in which you need to set the “Name” to “Login“, “URL” to “{$WEB.URL}/web-login.php” (this URL works only with WordPress).
And now, we can associate the post field names that we got in the step “Search for mail field when signing in” with our newly created variables:
| Post field Name | Post field Value |
| log | {user} |
| pwd | {password} |
| wp-submit | {submit} |
Enable “Follow redirects” and set “Required string” to “>Log Out<” because if the login was successful “Log Out” button will appear on the page. You can find the string “>Log Out<” when viewing a page in HTML format using the Google / Firefox inspect tool.
Click the “Add” button at the bottom of the step window and go to the next step (do not click the “Add” button for the entire web scenario – we are not done yet!).
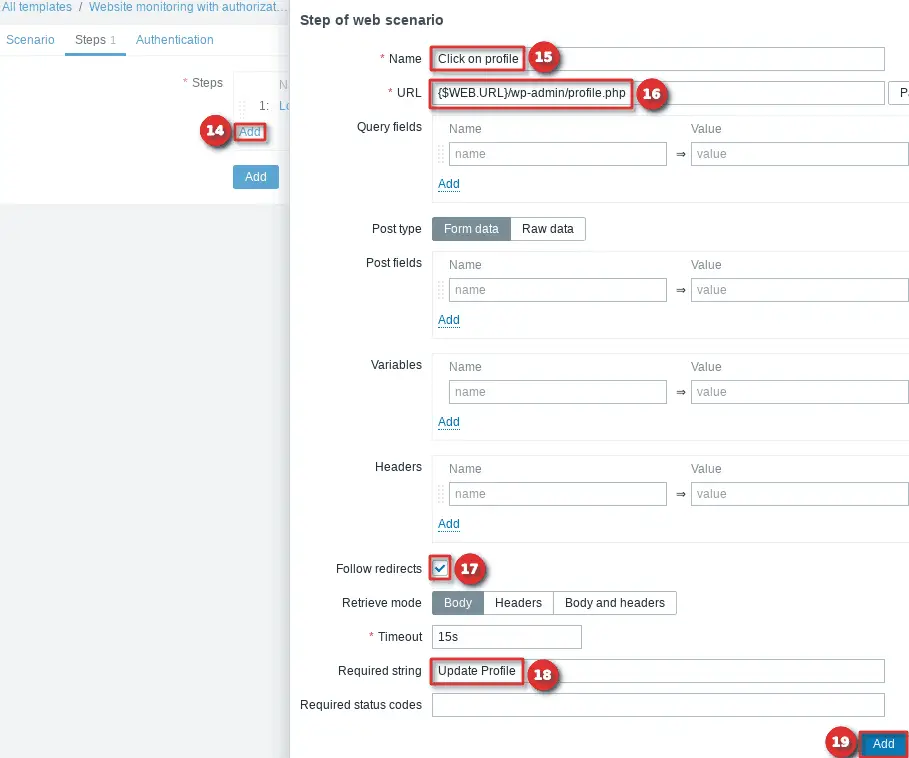
Web scenario step 2: Create “Click on profile” web scenario
Now we need to create a step that will open another webpage after the login to confirm that the website is alive and responsive. Set the “Name” to “Click on profile“, “URL” to “{$WEB.URL}/wp-admin/profile.php” (this URL will open user profile webpage on the WordPress).
Enable “Follow redirects“, and paste “Update Profile” into the “Required string” because if the webpage is successfully loaded the “Update Profile” button will appear on the page.
Click the “Add” button at the bottom of the step window and go to the next step (do not click the “Add” button for the entire web scenario – we have one more step left!).
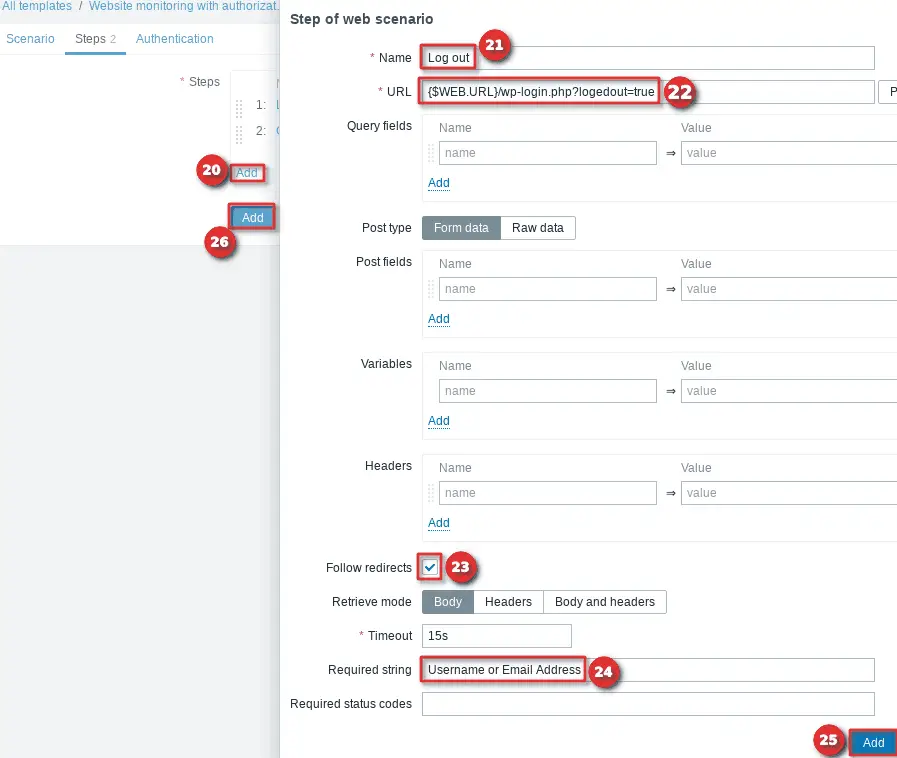
Web scenario step 3: Create “Log out” web scenario
This is the last step, let’s create a scenario that will do a logout. Set the “Name” to “Logout“, “URL” to “{$WEB.URL}/wp-login.php?logedout=true” (this URL will logout a user from the WordPress website). Alternatively, you can use “Post fields”, but for simplicity, I will set the post fields directly in the URL by adding “?logedout=true”.
Enable “Follow redirects“, and paste “Username or Email Address” into the “Required string” because if the user is successfully logged out the “Username or Email Address” field will appear on the page.
You can now click the “Add” button for the entire web scenario if all three web scenarios are displayed exactly as in the image below.
d ) Create a trigger for the advance web scenario
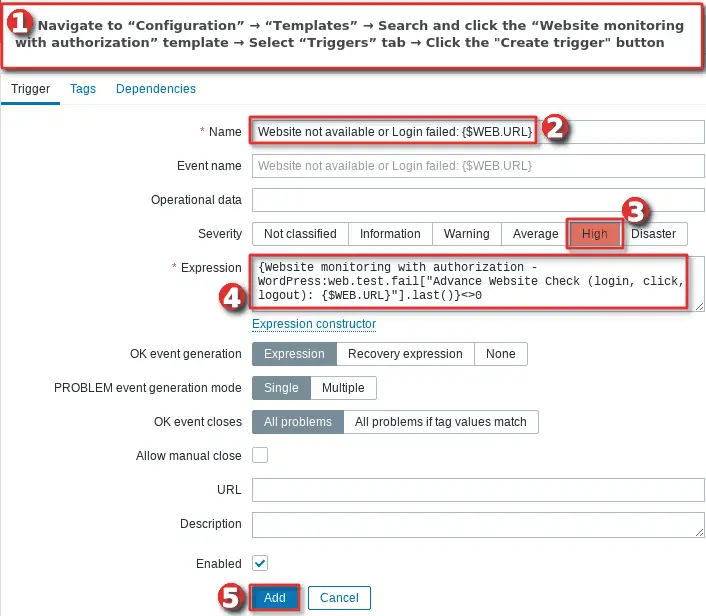
If you want to receive notifications when your site is unavailable or if user authorization fails, then you need to create Zabbix triggers. Update the “Website Monitoring with authorization” template by adding a new trigger. Navigate to “Configuration” → “Templates” → Search and click the “Website Monitoring with authorization” template → Select “Triggers” tab → Click the “Create trigger” button.
Set trigger name to:
Website not available or Login failed: {$WEB.URL}
Severity can be whatever you prefer. Add trigger expression using that little “Add” or manually as a text using this expression:
New syntax expression
last(/Website monitoring with authorization/web.test.fail["Advance Website Check (login, click, logout)"])<>0

Old syntax expression (Zabbix 5.2 and older)
{Website monitoring with authorization:web.test.fail["Advance Website Check (login, click, logout): {$WEB.URL}"].last()}<>0
Click that big “Add” button when you’re done configuring the trigger and thats it!
Use an existing host or create a new one just for the website monitoring like in the step “Step 3: Enable Website monitoring on the host in Zabbix” but set different template and macros.
Link the template “Website monitoring with authorization”, and under the “Macros” tab select the “Inherited and host macros” option and set values by clicking the “Change” on macros {$WEB.URL}, {$WEB.PASW}, and {$WEB.USER}.
Nice job! You have configured advanced website monitoring with authorization.
Step 6: Automate web scenario and trigger creation
You may have noticed that the process of creating web scenarios on Zabbix is slow and tedious. There is no automation, no low-level discovery (LLD)!
What if you want to monitor a couple of thousand pages in Zabbix? Unfortunately, to do that you would have to create it all manually unless you throw yourself into scripting. Luckily, there is no need for that, because I’ve already created a Zabbix script that automatically discovers and monitors web pages using a list of web page URL’s. The easiest way is to use a sitemap but you can also use a text file or manually enter a list of URLs within the macro.
But first thing first, let’s install some python modules that our script needs and tweak the Zabbix server configuration file.
a) Install py-zabbix python module
Install python 3, python-requests and python-setuptools:
# RHEL / CentOS / Oracle Linux / Rocky Linux
yum install -y python3 python3-requests python3-setuptools curl

                                 OR

# Ubuntu / Debian / Raspberry OS
sudo apt install python3 python3-requests  python3-setuptools curl
Install python-zabbix module:
# Install zabbix_utils using pip3
sudo  pip install zabbix_utils
b) Download webmonitoring script
Please use the commands below to download my script webmonitoring.py and place it in your Zabbix ExternalScripts directory.
Don’t know the path of ExternalScripts directory? Use the Zabbix configuration file to find out where the Zabbix ExternalScripts directory is located:
grep "ExternalScripts=" /etc/zabbix/zabbix_server.conf
The output of the command should be similar to this:
# ExternalScripts=/usr/lib/zabbix/externalscripts # this is default
Now download my script webmonitoring.py to that directory:
curl -o /usr/lib/zabbix/externalscripts/webmonitoring.py https://bestmonitoringtools.com/dl/webmonitoring.py
And set executable permissions on the script:
chmod +x /usr/lib/zabbix/externalscripts/webmonitoring.py
c) Update Zabbix server configuration file
When monitoring a large number of websites Zabbix will generate an alarm “Zabbix HTTP poller processes more than 75% busy“. As a result, some polling data will be lost. To avoid this, you need to increase the number of HTTP pollers in the Zabbix server configuration file.
Open “zabbix_server.conf” file with command: “nano /etc/zabbix/zabbix_server.conf” and add (or change) these parameteres:
StartHTTPPollers=10
Also, the script will need more time to complete, therefore add (or change) the Timeout parameter and set it to 30 seconds:
Timeout=30
Save and exit file (ctrl+x, followed by y and enter). Learn more about the timeout parameter and what impact its change has on Zabbix in my old blog post.
In order to apply the new settings you need to restart the Zabbix server, so let’s do that:
systemctl restart zabbix-server
d) Download and import template
Now that we have the script in place, we need to set up a template that will use our script. Download the template “Web monitoring with discovery” and import it to Zabbix via frontend.
To do this, navigate to the “Templates” under the “Configuration” section and click the “Import” button, then select the downloaded template file and import it.
e) Create a host and configure macros (API credential, source of URLs etc.)
Almost done! Add a new host to Zabbix that will use our template and script to create all the triggers and graphs for each monitored website.
Create a host, link the “Web monitoring with discovery” template and use a similar setting as in the image below.
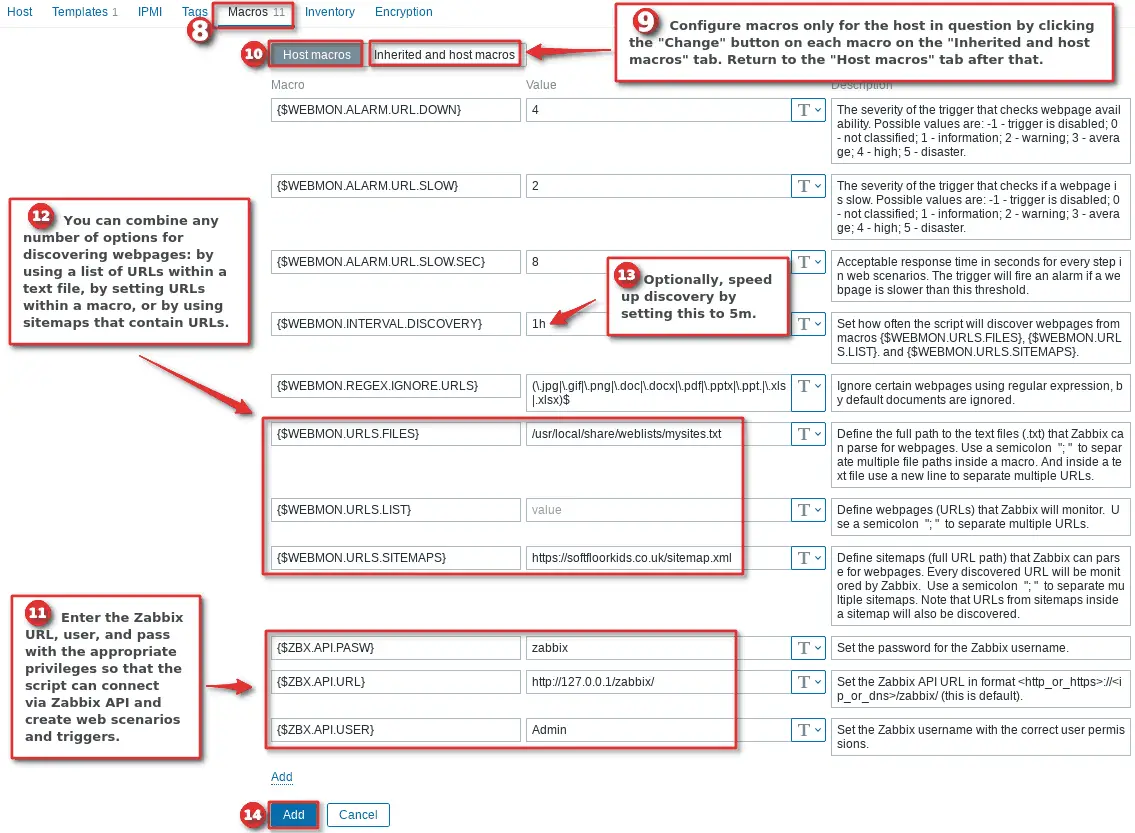
Don’t click the “Add” button yet! Now comes the important part – configure macros according to the instructions in the macro description. See my example in the image below.
A few notes, if you want to monitor a few web pages, manually add URLs in the “{$WEBMON.URLS.LIST}” macro. However, if you monitor more than 3 URLs, then define the sitemap URL using “{$WEBMON.URLS.SITEMAPS}” macro (in some cases, website security will block the reading of the website sitemap) or the full DIR path of the text file that contains a list of URLs using {$WEBMON.URLS.FILES} macro . Rember that you can combine any number of options or use just one!
Also don’t forget to set the correct user permissions if you are using the text file option, for example: “chown zabbix.zabbix /usr/lib/zabbix/externalscripts/sites.txt”.
f) Check that the monitoring is working properly
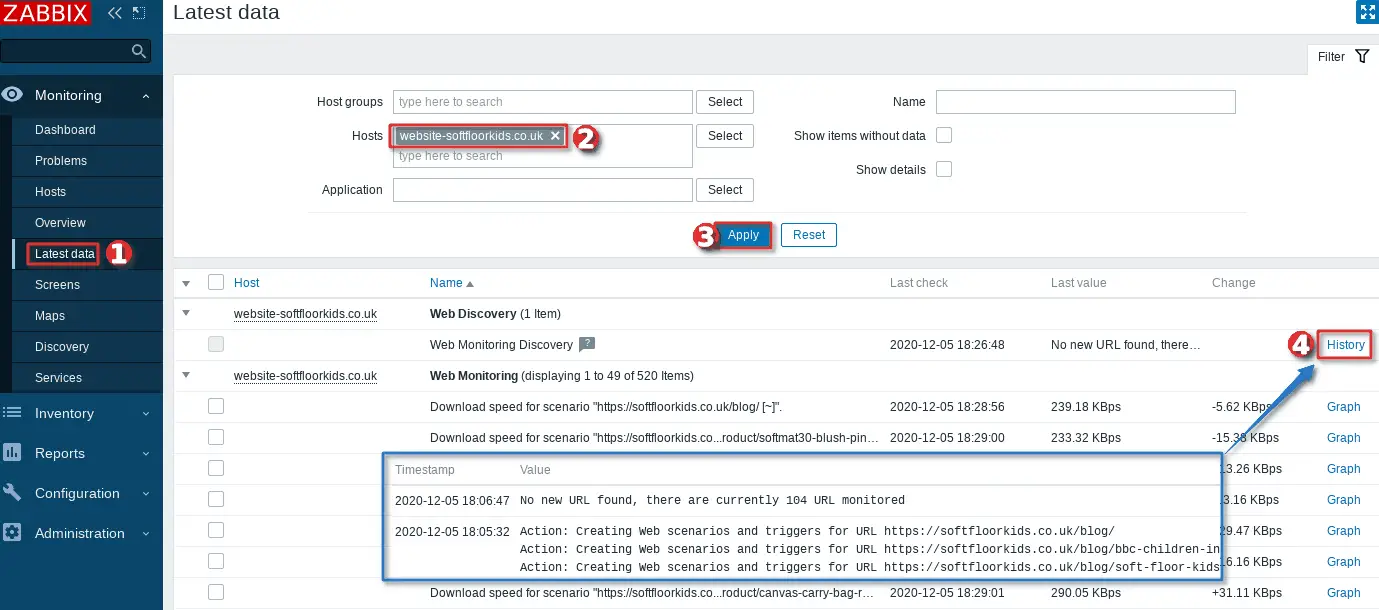
To verify that monitoring is working properly, go to “Latest Information” in the “Monitoring” section and select your host in the “Hosts” field.
Want to receive email alerts when your website is down? Learn how to setup Zabbix email notifications and escalations!






Great Tutorial…
I need some help on the following …. I am trying to use the script but I don’t want or am not using the API functionality as of yet can I disable it or is there something that I am missing … Please see the following errors any help would be greatly appreaciated.
raceback (most recent call last):
File “/usr/lib/zabbix/externalscripts/webmonitoring.py”, line 171, in
main()
File “/usr/lib/zabbix/externalscripts/webmonitoring.py”, line 40, in main
zapi.login(user=api_user,password= api_pass)
File “/usr/local/lib/python3.9/site-packages/zabbix_utils/api.py”, line 256, in login
self.__session_id = self.user.login(**user_cred)
File “/usr/local/lib/python3.9/site-packages/zabbix_utils/api.py”, line 94, in func
return self.parent.send_api_request(
File “/usr/local/lib/python3.9/site-packages/zabbix_utils/api.py”, line 387, in send_api_request
raise APIRequestError(err)
zabbix_utils.exceptions.APIRequestError: Application error. Incorrect user name or password or account is temporarily blocked.
Hello.
Getting
Traceback (most recent call last):
File “/usr/lib/zabbix/externalscripts/webmonitoring.py”, line 171, in
main()
File “/usr/lib/zabbix/externalscripts/webmonitoring.py”, line 42, in main
host_data = zapi.host.get(selectMacros=”extend”, filter={“host”: zbx_host})[0]
~~~~~~~~~~~~~~~~~~~~~~~~~~~~~~~~~~~~~~~~~~~~~~~~~~~~~~~~~~~~~~~^^^
IndexError: list index out of range
What could be the cause of this?
Hi Team,
I configured the website’s login alert in Zabbix, but it uses SAML authentication. Whenever I access the website URL in the browser, it redirects me to the SAML authentication page and generates different URLs each time it shows the username and password fields. Is it possible to set up a login alert with such dynamic URLs in Zabbix? Does Zabbix support this? I’m using Zabbix version 7.0.4.
Looking forward to your valued input. Thanks,
Hi there,
After following guide ‘c) Create a trigger (alarm) for the web scenario’ I get error message for Website is SLOW ({ITEM.LASTVALUE}): {$WEB.URL}.
Error message:
Incorrect item key “web.test.time[Website Health Check: {$WEB.URL},Webpage Availability,resp]” provided for trigger expression on “Website monitoring”.
Website Availability is set up in Scenario/Steps.
Zabbix version 7.0.6
What’s going wrong?
Hello, I am getting this error in latest data
SSL connect error: OpenSSL SSL_connect: SSL_ERROR_SYSCALL in connection to domain-name:443
getting alert over mail as website not available and after hitting the domain it will working fine and next one minute it throwing resolve email and i am getting email frequently .
Great tutorial, thanks!
Regarding step 6 (automation), what permissions exactly do we need to give to the user account used by the script?
I created a new user role of type admin, removed all accesses to UI elements, gave no access to services (RW none, Read none), enabled “Access to API’, then added trigger.* in the “Allow list” but I don’t find any API method for web scenarios. I also disabled all “Access to actions”.
You need to have read and write permissions for the script, so the best thing is to set the API user to admin or play with permissions 🙂
Hi After many attempts I keep getting this error:
can you help me?
Traceback (most recent call last):
File “/usr/lib/python3/dist-packages/urllib3/connection.py”, line 169, in _new_conn
conn = connection.create_connection(
File “/usr/lib/python3/dist-packages/urllib3/util/connection.py”, line 73, in create_connection
for res in socket.getaddrinfo(host, port, family, socket.SOCK_STREAM):
File “/usr/lib/python3.10/socket.py”, line 955, in getaddrinfo
for res in _socket.getaddrinfo(host, port, family, type, proto, flags):
socket.gaierror: [Errno -2] Name or service not known
During handling of the above exception, another exception occurred:
Traceback (most recent call last):
File “/usr/lib/python3/dist-packages/urllib3/connectionpool.py”, line 699, in urlopen
httplib_response = self._make_request(
File “/usr/lib/python3/dist-packages/urllib3/connectionpool.py”, line 382, in _make_request
self._validate_conn(conn)
File “/usr/lib/python3/dist-packages/urllib3/connectionpool.py”, line 1012, in _validate_conn
conn.connect()
File “/usr/lib/python3/dist-packages/urllib3/connection.py”, line 353, in connect
conn = self._new_conn()
File “/usr/lib/python3/dist-packages/urllib3/connection.py”, line 181, in _new_conn
raise NewConnectionError(
urllib3.exceptions.NewConnectionError: : Failed to establish a new connection: [Errno -2] Name or service not known
During handling of the above exception, another exception occurred:
Traceback (most recent call last):
File “/usr/lib/python3/dist-packages/requests/adapters.py”, line 439, in send
resp = conn.urlopen(
File “/usr/lib/python3/dist-packages/urllib3/connectionpool.py”, line 755, in urlopen
retries = retries.increment(
File “/usr/lib/python3/dist-packages/urllib3/util/retry.py”, line 574, in increment
raise MaxRetryError(_pool, url, error or ResponseError(cause))
urllib3.exceptions.MaxRetryError: HTTPSConnectionPool(host=’x’, port=443): Max retries exceeded with url: /zabbix/api_jsonrpc.php (Caused by NewConnectionError(‘: Failed to establish a new connection: [Errno -2] Name or service not known’))
During handling of the above exception, another exception occurred:
Traceback (most recent call last):
File “/usr/lib/zabbix/externalscripts/webmonitoring.py”, line 199, in
main()
File “/usr/lib/zabbix/externalscripts/webmonitoring.py”, line 44, in main
zapi.login(api_user, api_pass)
File “/usr/local/lib/python3.10/dist-packages/pyzabbix/api.py”, line 123, in login
self.version = Version(self.api_version())
File “/usr/local/lib/python3.10/dist-packages/pyzabbix/api.py”, line 187, in api_version
return self.apiinfo.version()
File “/usr/local/lib/python3.10/dist-packages/pyzabbix/api.py”, line 278, in __call__
return self._parent.do_request(self._method, args or kwargs)[“result”]
File “/usr/local/lib/python3.10/dist-packages/pyzabbix/api.py”, line 216, in do_request
resp = self.session.post(
File “/usr/lib/python3/dist-packages/requests/sessions.py”, line 592, in post
return self.request(‘POST’, url, data=data, json=json, **kwargs)
File “/usr/lib/python3/dist-packages/requests/sessions.py”, line 544, in request
resp = self.send(prep, **send_kwargs)
File “/usr/lib/python3/dist-packages/requests/sessions.py”, line 657, in send
r = adapter.send(request, **kwargs)
File “/usr/lib/python3/dist-packages/requests/adapters.py”, line 516, in send
raise ConnectionError(e, request=request)
requests.exceptions.ConnectionError: HTTPSConnectionPool(host=’x’, port=443): Max retries exceeded with url: /zabbix/api_jsonrpc.php (Caused by NewConnectionError(‘: Failed to establish a new connection: [Errno -2] Name or service not known’))
It seems like you didn’t set the Zabbix API URL, user, or password correctly. Please double-check everything.
First of all thank you for this really helpful article! I really appreciate it.
However, I noticed one thing afterwards. Under point 2 b) in the note at the bottom, you point out that if you don’t want to have so many notifications, you can replace the last() function with the max() function. However, this does not work as you have described, as the max() function always compares the highest value within a time period with the following constant. However, if we now receive 7 times 0 and 1 times 1 within 2 minutes, the trigger would be activated even though the website was only unavailable for one query. The correct function in this case would be the min() function, as this would only return 1 if all queries within 2 minutes returned a 1. Since the min() function always outputs the lowest value within a defined time period.
Thanks for the correction. I have updated the tutorial. Regards.
hi
how can i set multible website monitoring on one host? when i want to set second {$WEB.URL} it says already exist.
Step 6 involves using a script to automatically create multiple web scenarios. Alternatively, you can create them manually, but instead of using the MACRO {$WEB.URL}, please insert your new URL. Regards
hi
thanks for your good document.
i created template and trigger and it worked successfully and show down state of website in dashboard.
but after website recovered dont show that state in dashboard . i want to hide down state after solve the problem in dashboard.
If you followed all the steps, the alert should be cleared by Zabbix. Review you steps again. Regards
If you followed all the steps, the alert should be cleared by Zabbix. Review your steps again. Regards
An excellent tutorial. The zabbix documentation opened many questions that were closed here.
Thanks!
Hello, I am getting this error when running the script
host_data = zapi.do_request(“host.get”, {“selectMacros”: “extend”, “filter” : {“host” : zbx_host}})[‘result’][0]
IndexError: list index out of range
I have tried testing from command line, the API user and password are correct as changing those gives me a different wrong password error.
When printing the zapi.do_request only to debug, it gives me this
ubuntu@myZabbixHost:/usr/lib/zabbix/externalscripts$ python3 webmonitoring.py ‘http://MYZABBIXURL.com’ ‘api.user’ ‘passwordOfAPIUser’ ‘WebMonitoring’ ‘4’ ‘2’ ‘(\.jpg|\.gif|\.png|\.doc|\.docx|\.pdf>’
{‘jsonrpc’: ‘2.0’, ‘result’: [], ‘id’: ‘1’}
I have updated the script, can you download the scriptand try again? Thx
Traceback (most recent call last):
File “/usr/share/zabbix/externalscripts/webmonitoring.py”, line 196, in
main()
File “/usr/share/zabbix/externalscripts/webmonitoring.py”, line 41, in main
zapi = ZabbixAPI(url=api_url, user=api_user, password=api_pass)
TypeError: __init__() got an unexpected keyword argument ‘url’
Does anybody have this error?
If so how did you fix it?
Have you setup MACROs with Zabbix API URL, user and password?
max(/Website_monitoring/web.test.fail[Website Health Check: {$WEB.URL}],5m)0
Is this the correct trigger for the afterimage bloom when the page hasn’t been running for 5 minutes
max(/Website_monitoring/web.test.fail[Website Health Check: {$WEB.URL}],5m)0
very, very new at this, but I’m hoping to settle down the notifications when my website is flapping.
I set the recovery expression to:
max(/Website Monitoring/web.test.fail[Website Health Check: {$WEB.URL}],5m)=1
Keep Rocking
Thanks,
Amazing that Zabbix has failed to produce such a document in the past 20 years, they should hire you to write for them.
Well said! Yeah Definitely
Good afternoon.
I would like to monitor price on a website, however this price may vary.
and to see such prices a login is required that follows the following
Here I created a scenario with steps
Scenario:
Here I did the field mapping.
Phases:
1 – Enter page with username and password
fields: ‘UserPasswor’d and ‘UserPassword’
Login URL: http://
Redirected on the same page to the frame below
2 – After logging in, it asks me for a seller’s data
field: seller_id
The URL does not change, it remains the one above
3 – Page of the product in question
After logging in I go to the product page and get some data like Query consult “data-price”
tried using data-price in header and body
but it looks like i need to create an item, if you can give me some direction i would be very grateful
When I am trying to create the slow website trigger, I get:
Incorrect item key “web.test.time[Website Health Check: {$WEB.URL},Webpage Availability,resp]” provided for trigger expression on “Website monitoring”.
What am I doing wrong?
Use it instead of the sample pattern. I think that is incorrect.
Wrong:
avg(/Website monitoring/web.test.time[Website Health Check: {$WEB.URL},Webpage Availability,resp],10m)>8
Use:
avg(/Website monitoring/web.test.time[Website Health Check: {$WEB.URL},Website Availability,resp],10)>8
Is there any particular format to the txt file which contains the URL list? how should those URLs be seperated?
Just paste each URL in a new line.
With the template I can monitor a website by host, how can I monitor several websites that are contained in the same host? your help please
You have two options:
1. Don’t use macro {$WEB.URL}, create multiple web scenarios and manually type URL
2. Check “Step 6: Automate web scenario and trigger creation” and let the python do all the work automatically
Regards
Thanks, its very useull, but y have a question if i have several web sites in one server how i check all because when i try to check the second said that {$WEB.URL} already exist.
You have two options:
1. Don’t use macro {$WEB.URL}, create multiple web scenarios and manually type URL
2. Check “Step 6: Automate web scenario and trigger creation” and let the python do all the work automatically
Regards
thank you very much, this will be very useful
About monitoring, bestmonitoringtools.com is always my first choice!
Thank you so much for this!
WOW !
There are so many websites and forums about Zabbix and I was looking for “THE ONE” because otherwise I will keep on looking for information instead of focusing and actually implementing something in Zabbix.
This website is looking very good, it seems to contain what I am looking for, many thanks !!