Would you like to learn how to monitor Cisco Switch or Router with free and open-source monitoring software called Zabbix?
Well then, you are in the right place, because in this tutorial I will show you how you can setup network monitoring (Cisco switch / router) on Zabbix in just a couple of minutes!
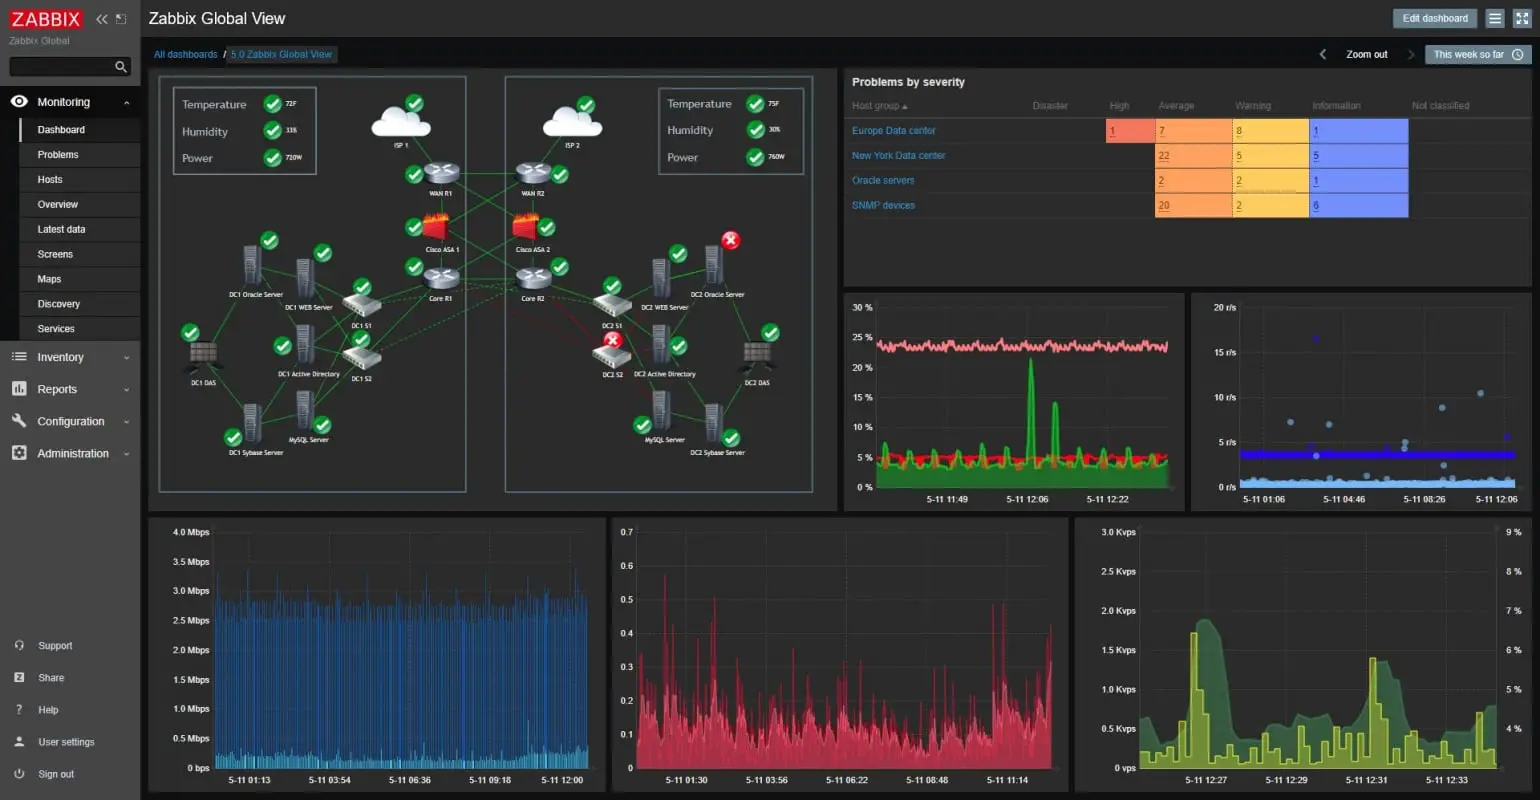
Zabbix is not limited only to network monitoring, it can monitor virtually anything: Linux and Windows servers, VMware environment, websites, databases, docker containers, and more. Learn more about Zabbix on the official website.
Note that you can use this Cisco guide to monitor any router or switch (HP, Juniper, Huawei, Mikrotik, Dell, F5, Ubiquiti, ZYXEL, Arista, Brocade, TP-LINK, etc.) because Zabbix comes with tons of network templates that are available immediately after the installation (out-of-box).
In this guide we will configure Zabbix to monitor network traffic (bandwidth), CPU utilization, power supply and serial numbers on Cisco switches and routers that use classic IOS (like Cisco Catalyst 3650, 3750, 3850, 2960, 2950, 2801, 2911 or routers 1841, 1921, etc.).
Keep in mind that you can also use this tutorial for montoring routers that use IOS-XR (like CRS series, 12000 series, and ASR9000 series, etc.) or Nexus switches (like series 7000, 9000, etc. )
Why this guide? My friend asked me to help him with Zabbix. He needed to monitor Cisco routers and switches. I was like: “Why me? There are zillion tutorials online for that!”. He replied: “But there is no guide for total beginners with zero Linux experience”.
And he was right! It can be hard to find the right tutorial for network monitoring that will guide you from scratch.
So without further ado let’s get started!
We will setup network monitoring on Zabbix and monitor Cisco switch and router with SNMP protocol (Don’t know what is SNMP protocol? Learn step by step: MIB, OID, Agent, Manager).
Table of Contents
Step 1: Configure SNMP on the Cisco Switch or Router
Configure SNMPv2c on Cisco routers and switches with one command as shown below:
switch> enable
switch# configure terminal
switch(config)# snmp-server community MyCommunity RO
switch(config)# exit
switch# copy running-config startup-config
That will cover most Cisco devices, but if you need to use SNMPv3 or configure Nexus or ASA firewall then read this short tutorial.
My favorite tool for testing SNMP is Net-SNMP. On Ubuntu/Debian you can install Net-SNMP tools with one simple command: “apt-get install snmp“, or if you have CentOS/RHEL you can use “yum install net-snmp net-snmp-utils“.
Run the following Net-SNMP command from Linux machine to verify that SNMP is working as configured on the device:
snmpwalk -v2c -c MyCommunity 192.168.1.1 1.3.6.1.2.1.1.1
iso.3.6.1.2.1.1.1.0 = STRING: "Cisco IOS Software, Catalyst 4500 L3 Switch Software (cat4500-ENTSERVICESK9-M), Version 12.2(54)SG1, RELEASE SOFTWARE (fc1)
Technical Support: http://www.cisco.com/techsupport
Copyright (c) 1986-2011 by Cisco Systems, Inc.
Compiled Thu 27-Jan-11 11:39 "
If your snmpwalk fails, then make sure that the network or local firewall on the device is not blocking UDP port 161.
Need more examples for Net-SNMP tool usage? Check out my post about snmpwalk / snmpget examples.
Step 2: Install Zabbix monitoring system
You can install Zabbix in 10 minutes. Depending on your operating system (OS) preferences you can follow CentOS/Alma/Rocky/RHEL, Ubuntu, Debian, Raspberry Pi (Rasbian) tutorial.
Step 3: Change global SNMP community string for all devices
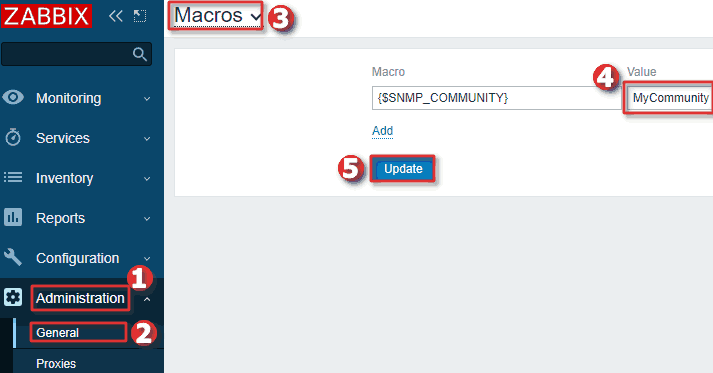
Zabbix needs SNMP community string to retrieve data from SNMP enabled devices. A community string is like a password. Global SNMP community string in Zabbix is “public” and if you are using something else than you need to change it.
You can change community string for all devices by changing value for macro “{$SNMP_COMMUNITY}” under Administration→General→Macros just as shown in the picture below.
WELL DONE!
SNMP is enabled on the device and Zabbix is ready for monitoring. Now it’s time to add that device to Zabbix.
Step 4: Add host to Zabbix with appropriate SNMP template
Go to the “Hosts” menu under the “Configuration” tab and click the “Create host” option to create a host in Zabbix. Define the name of your switch/router in the “Host name” field and choose the appropriate template for your Cisco device under the section “Templates” by typing “Cisco”. Select the “Cisco IOS SNMP” template if you are not sure what to choose.
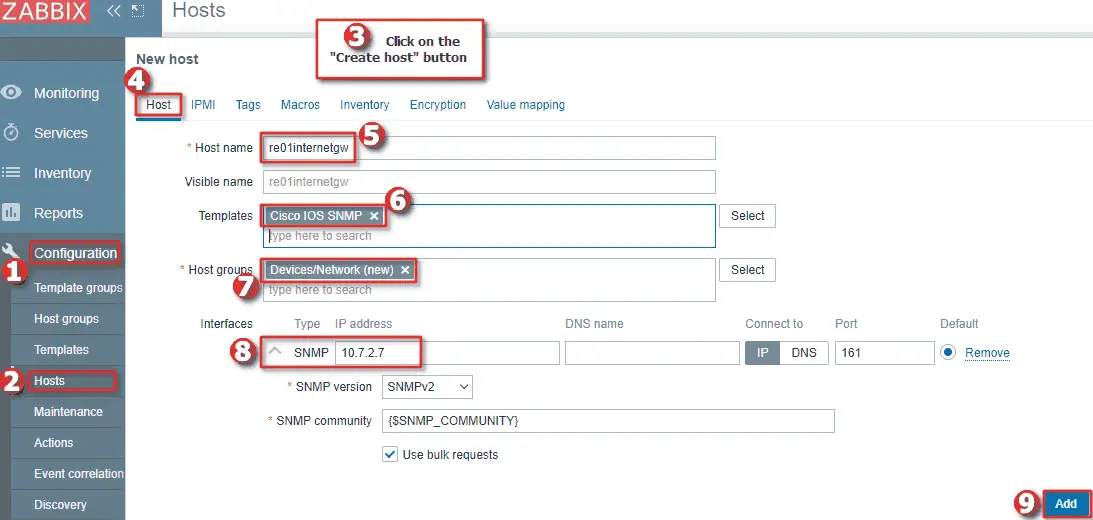
Next, set “Groups” using existing host groups or create a new one. Then add SNMP interface under the “Interfaces” section and set the IP address of the device.
CONGRATULATIONS!
You have successfully configured network monitoring (Cisco router and switch) on Zabbix!
No need to change anything else as other steps are optional.
CONTINUE TO LEARN MORE:
How to use Clone option?
Create discovery rules and action to automatically add devices to Zabbix
Change community string per host
How to force instant data collection
Step 5: Tips and tricks (optional)
This step is optional, but I strongly recommend the tips and tricks from this section, as they will ease your host administration in Zabbix.
a) Use Clone option
After you have added your first device you can add other similar devices very fast by using “Clone” option. Clicking on “Clone” will retain all host parameters and template linkage (don’t use “Full clone” option because it will retain directly attached entities: applications, items, triggers, graphs, low-level discovery rules, and web scenarios).
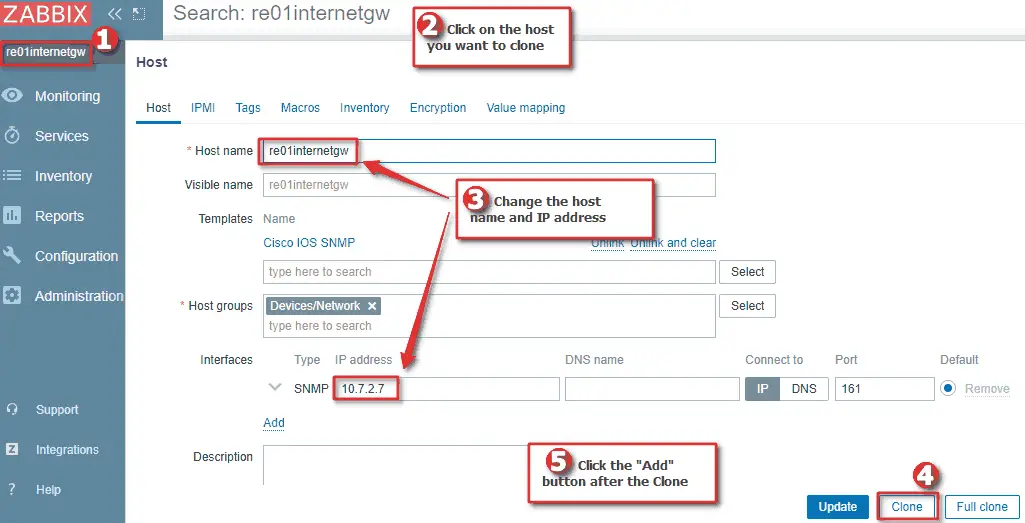
Steps for clonning are very simple. Find the host that you want to clone with the “Search” option. Click on the “Clone” option, then change the “Host name” and “IP address” and add a new host by pressing “Add” button
b) Create discovery rules and action to automatically add devices to Zabbix
Adding hosts to Zabbix manually is tedious job, and even with the “Clone” option, it’s still slow and error-prone process. Wouldn’t it be great if Zabbix could automatically discover devices on the network, add them to the appropriate host group and link them to the appropriate template depending on whether it was a Cisco, Juniper, HP, Mikrotik, Huawei device?
Well, good news! Zabbix can do just that! Let me show you.
I will configure Zabbix discovery rule that will scan the network and search for SNMP enabled devices. Discovery will query devices with SNMP OID 1.3.6.1.2.1.1.1 (sysDescr) which contains a lot of information about the vendor, hardware, and software versions of the device. This information will allow us to add devices to the appropriate host group and link them to the appropriate template.
Go to the “Discovery” under the “Configuration” section and click the “Create discovery rule” option. Define the name of your discovery and your network. You can set one network like 192.168.1.1-255 or use multiple networks divided with a comma just like I did in the picture below.
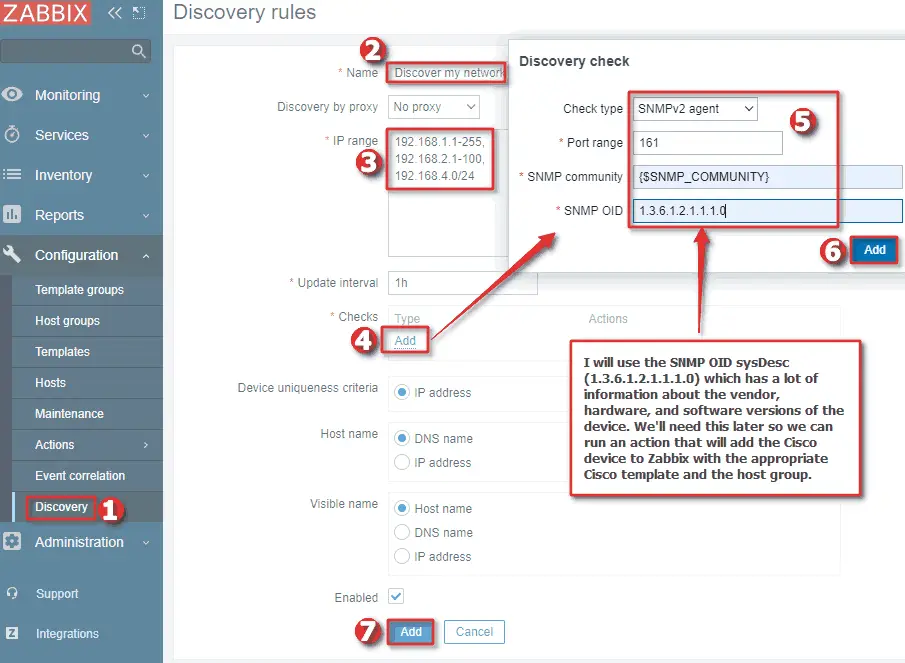
Under the section “Checks” add a discovery check that will use: SNMPv2 agent on port 161; default Zabbix SNMP community (you can change that to a another community ); and SNMP OID 1.3.6.1.2.1.1.1.0.
Click the “Add” button when you are done with the configuration.
Nice job! Zabbix will now scan the network and on the “Discovery” section under the “Monitoring” tab, you can view all the devices that Zabbix has found.
What now? Now we need to create a discovery action that will do something with discovered devices! In my case, I will configure a discovery action that will link Cisco devices to the Cisco template and add them to the host group for network devices.
Navigate to “Configuration“→ “Actions” → “Discovery actions” and click the “Create action” button in the upper right corner. Enter the name of your action and add 2 conditions just like in the image below. Condition A will make sure that this discovery check is only active on our newly create discovery rule, in my case that would be the discovery rule “Discover my network“, and condition B will take into account only devices that cointain the word “Cisco” in system description (1.3.6.1.2.1.1.1.0).
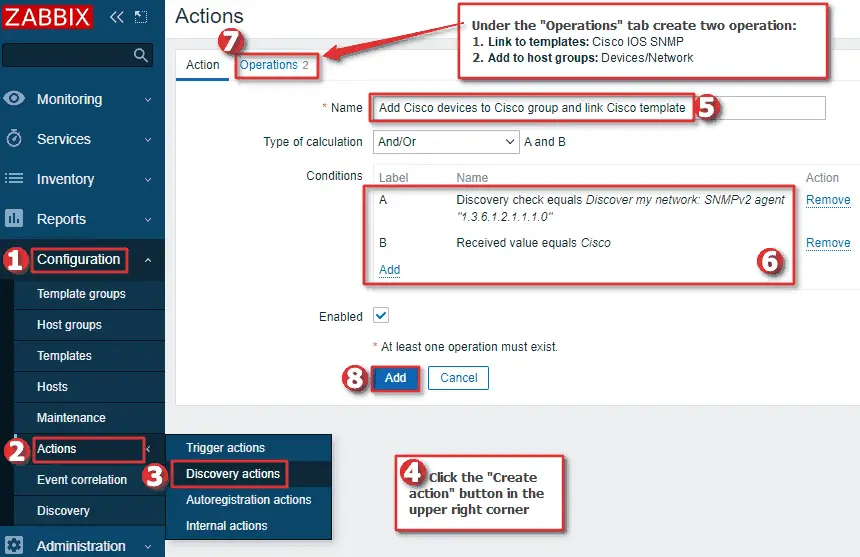
Next, under the “Operations” tab create two operation, one that will link the device to the “Cisco IOS SNMP” template, and the other that will add the device to the host group “Devices/Network” (of course you can link any template and add any group as you wish).
Click the “Add” button when you’re done with the configuration! And that’s all there is to Zabbix rules and discovery actions!
c) Use “Execute now” option to force instant discovery and data collection
It will take some time before Zabbix discovers components (interfaces, power supply, serial number, etc.) on the newly added device. Usually, it takes around 1 hour, but if you are impatient you can speed things up by using the “Execute now” option.
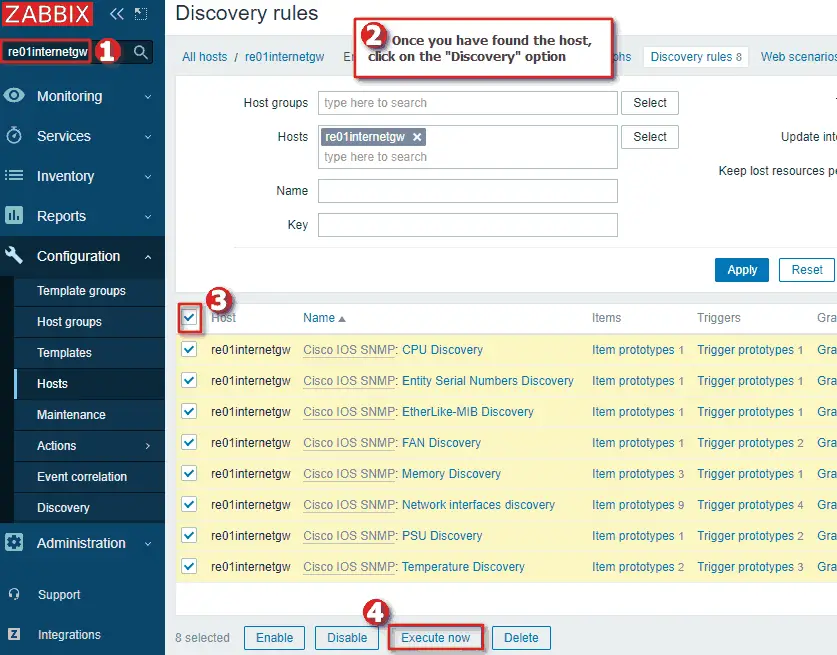
Find the host that you want to force an instant check with “Search” option and click on “Discovery“. Select all discoveries (LLD) and click “Execute now” option.
Most items have faster polling intervals (around 1 minute) so there is no need to use “Execute now” on them. However, you can force instant check even for them. Move to “Items” sections and do the same: select all items (ignore “SNMP trap” and “Zabbix Trapper” item types if present) and click “Execute now“.
d) Change SNMP community string per host (multiple SNMP community)
What if one device has a different SNMP community string and (for some reason) you can’t change it on the device? No problem, you can set different SNMP community on any host in Zabbix.
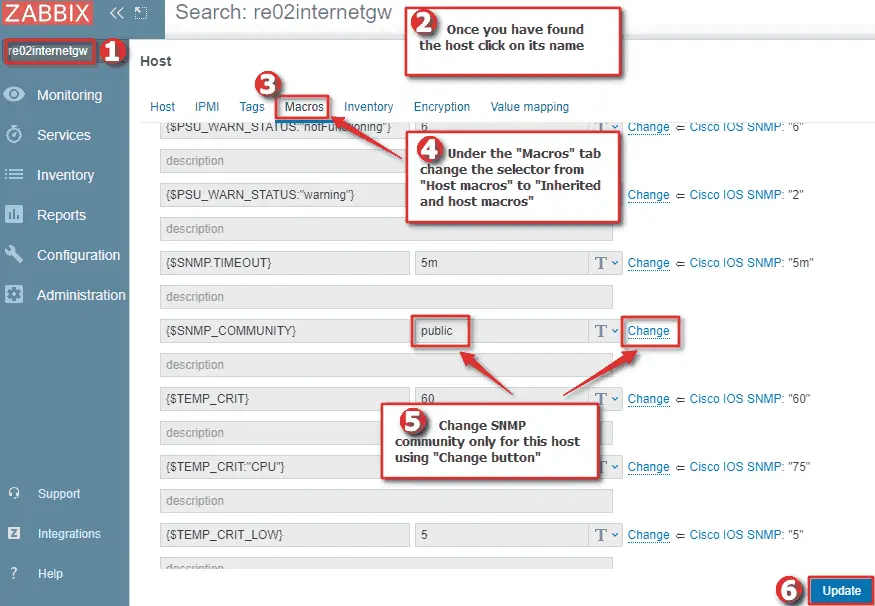
Find the host that that is using different SNMP community with the “Search” option. Under host configuration select “Macros” and change tab to “Inherited and host macros“. Click “Change” on macro “{$SNMP_COMMUNITY}” and enter your new community string. Hit the “Update” button after changing the SNMP community.
Under host configuration select “Macros” and change tab to “Inherited and host macros“. Click “Change” on macro “{$SNMP_COMMUNITY}” and enter your new community string. Hit the “Update” button after changing the SNMP community.
Thank you for reading.
Now, that you have your routers and switches monitored, you can try out Zabbix interactive topology maps!
Also, you can setup Zabbix email notifications and escalations in a few minutes

thanks very nice explaination great
Hi guys,
Thank you for the nice product and the nice documentation!
To add manually host by host for monitoring is pretty unusual those days!
I would suggest to prepare a a similar guide about how the automated discovery zabbix features can be used in order to discover, add to groups and associate with templates hosts with specific characteristics from the initial discovery phase.
Greets,
Alex
Thanks for the suggestion, I updated the guide!
I found this post very informative.
I have over 80 switches in the network. All the interfaces has been discovered and added to Zabbix, however I would like to monitor only the uplinks and increase their trigger priorities to high. Is there a way to monitor specific ports on a switch using Zabbix
Yes, you can monitor only specific links with Zabbix LLD override feature. I will update this tutorial with HowTo’s for that, so stay tuned.
Hello,
Using screens to monitor switches, for every interface you have to specify height and width. This is a thing which i don’t understand.
If I setup a screen with 2 columns and 25 rows, it’s obvious what i want. Why do I have to specify the size of each graph?
This creates another problem, if i do the screen on a 24 inch monitor it looks ok, but only on the 24 inches monitors,
if you access the same screen on a 15 inch laptop, the sizes are the same and don’t fit, you have to browse all around the web page (using the bottom scroll for left – right)
So, what are you using in zabbix to monitor interfaces of a switch? Is there a way to make these graphs auto resizing when resolution changes or browser size is changed?
Thank you and it’s appreciated.
Almost any PC/laptops support a min resolution of 1366×768, therefore set graphs to 600x 140 to make it fit on any resolution. However, graphs will not adapt/scale based on resolution. Alternatively, if you are using Zabbix 5.0 you can use his graph feature, it is much better than in the previous version.
Hey, thanks for your reply!
I am using zabbix 5.0, what graph feature are you referring to?
I want to monitor a 48 port switch. In dashboard if you want to add all the interfaces, there is not enough room to put all the widgets/interfaces.
If i use the screens feature, 2 column / 25 rows, it looks great but on the monitor you build it.
If i go to hosts -> graphs (per specific host), zabbix shows me half of interfaces, huge graphs and there are to many clicks till you get there (so not a solution)
How are you monitoring a switch with many interfaces?
Thank you again for help.
Hi,
I’m using host screens with graphs set to 600x 140, 2 columns / 100 rows. That view is the most practical for me.
Regards