Monitoring is the backbone of any successful IT operation, and choosing the right tools for the job is crucial. In this article, we’ll be comparing two of the top players in the monitoring space: Zabbix and Prometheus.
Whether you’re monitoring a network of servers, a cloud-based infrastructure, or a fleet of virtual machines, these tools have got you covered. They’ll alert you to problems before they turn into full-blown disasters, and help you visualize and understand what’s happening in your environment.
| Name | Links | Licence | Visits / Month | Reviews |
| Zabbix | Wiki,Twitter | Free | 750 000 | G2, Capterra, TrustRadius |
| Prometheus | Wiki,Twitter | Free | 470 000 | G2, Capterra, TrustRadius |
So let’s get started and see how these two tools stack up against each other!
Table of Contents
Overview of Zabbix
Zabbix is a powerful open-source monitoring platform that has been around for over a decade. It is used to monitor all aspects of your IT infrastructure, including networks, servers, virtual machines, and cloud resources. With its wide range of features and flexible architecture, Zabbix is a popular choice for organizations of all sizes.
Some of the key features of Zabbix include:
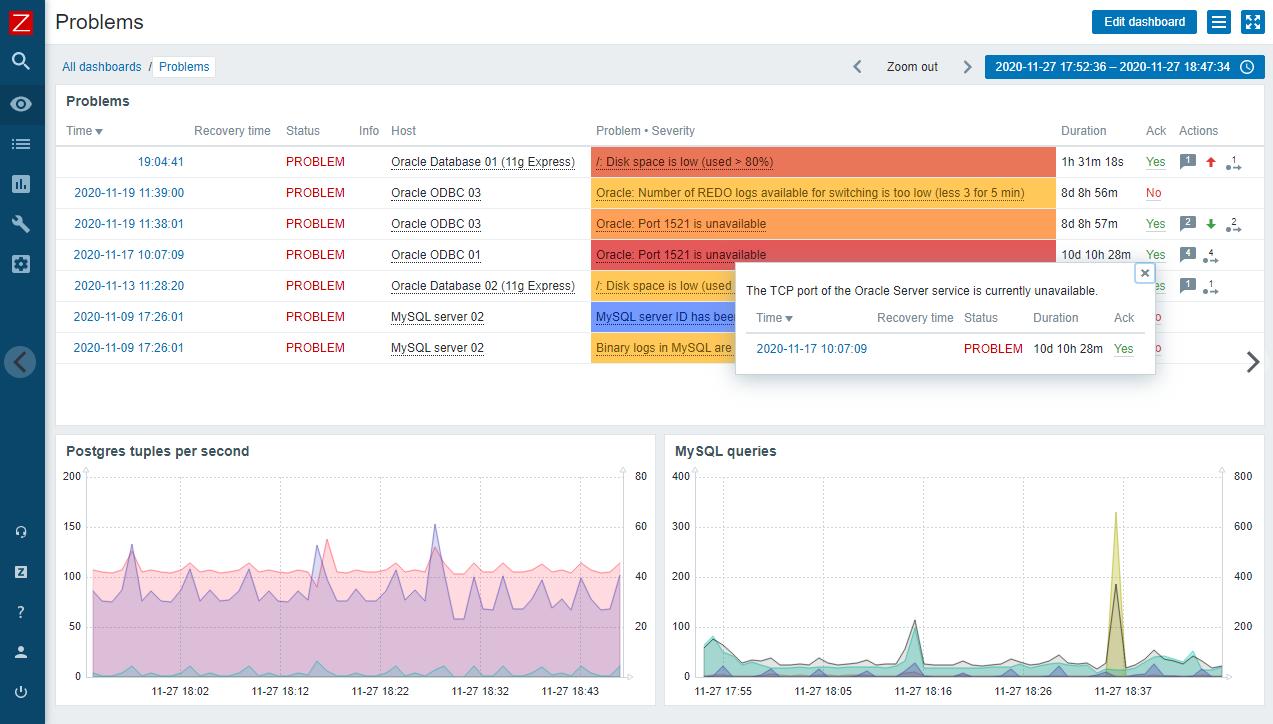
- Alerting: Zabbix has a comprehensive alerting system that can send notifications via email, SMS, or other channels when issues arise. It also supports event correlation, which allows to analyze and filter multiple events, reducing the number of false alarms. Additionally, it has a flexible alerting mechanism that allows to define multiple media types (email, sms, Jabber, etc) and alert scripts.
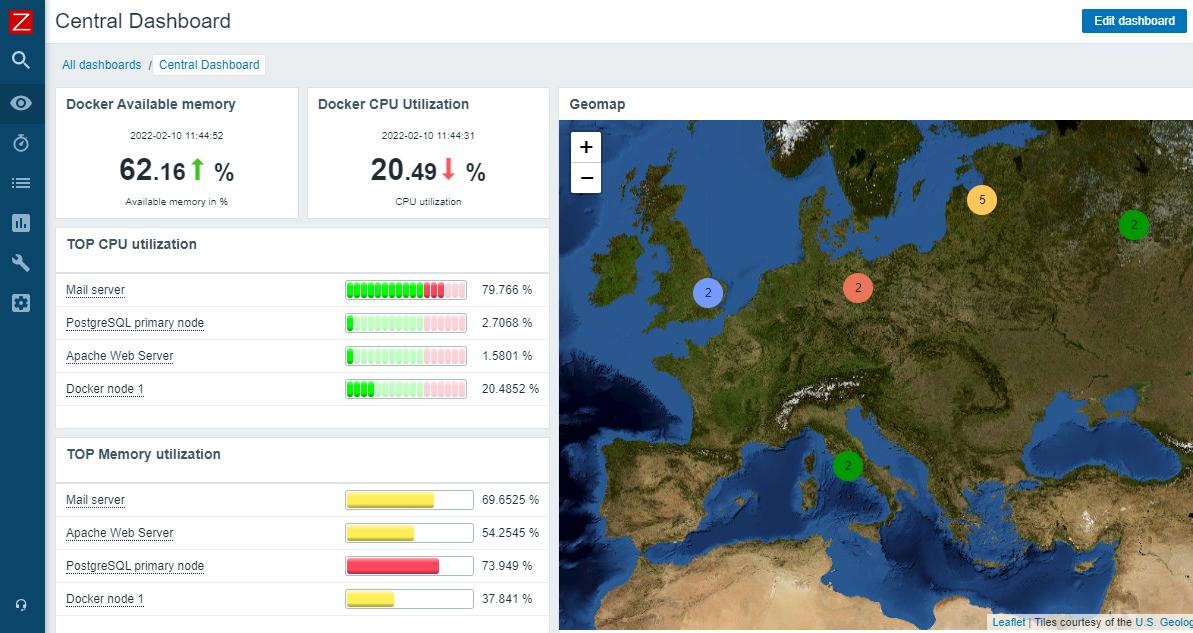
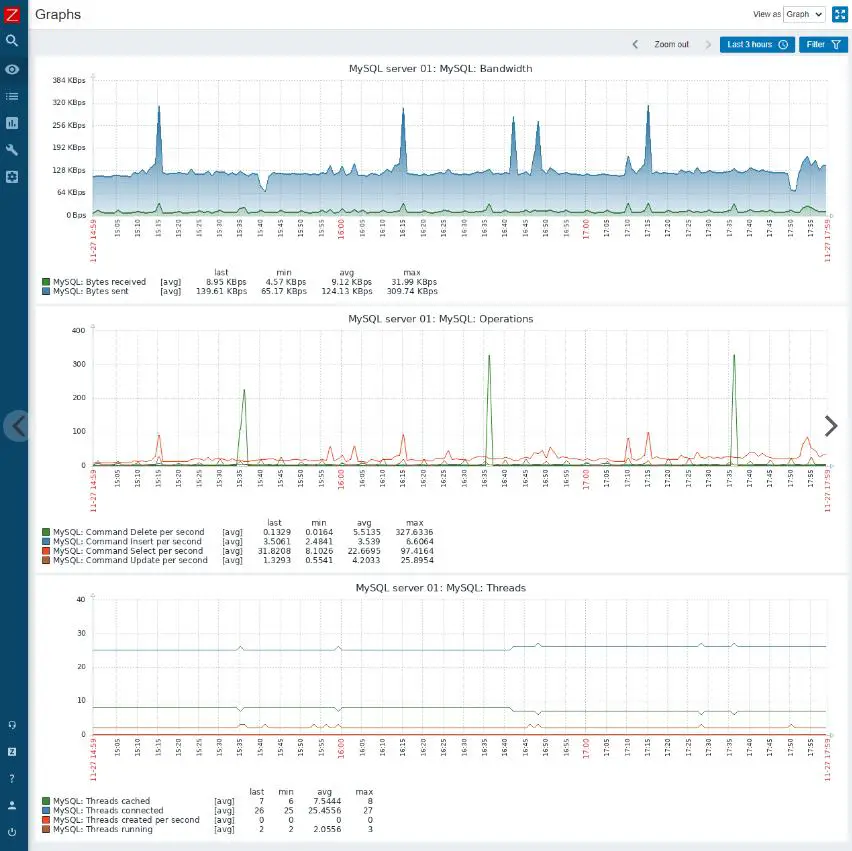
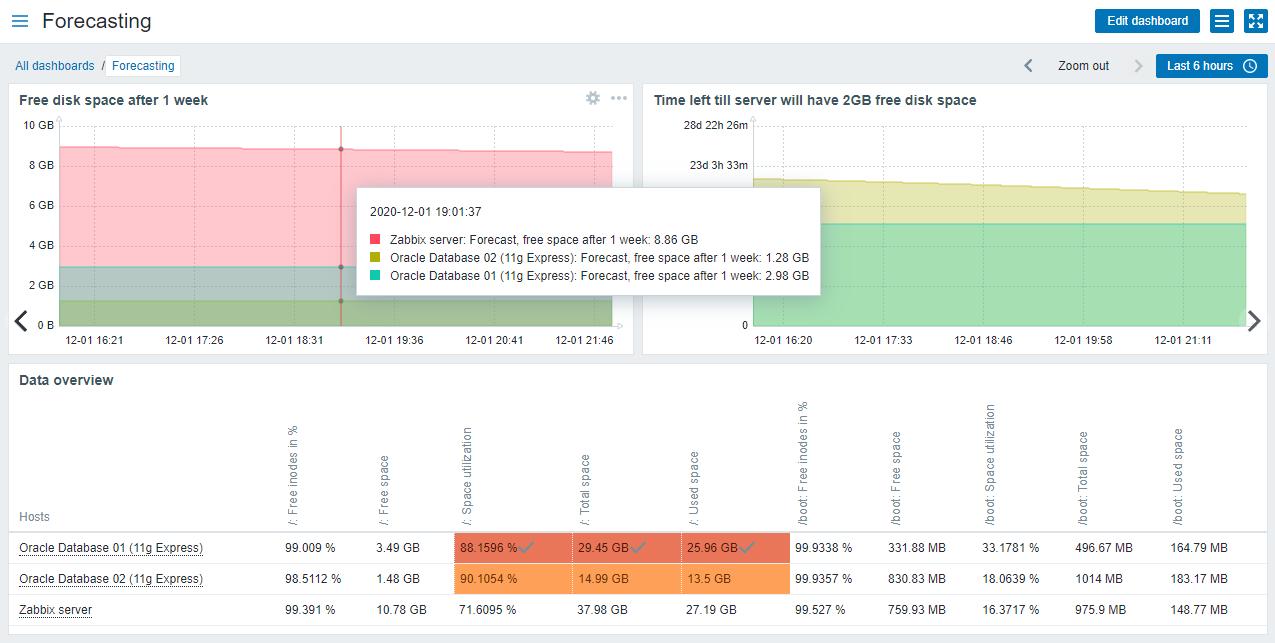
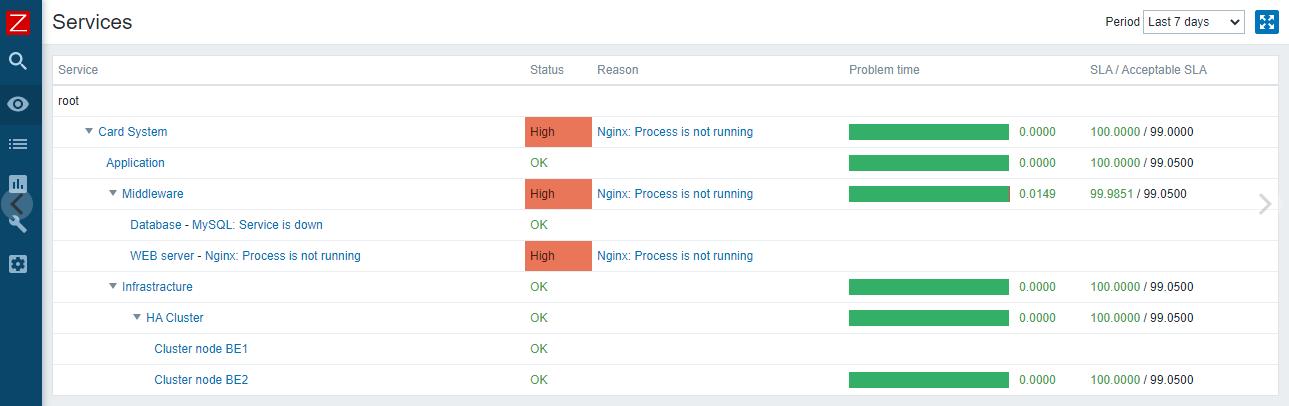
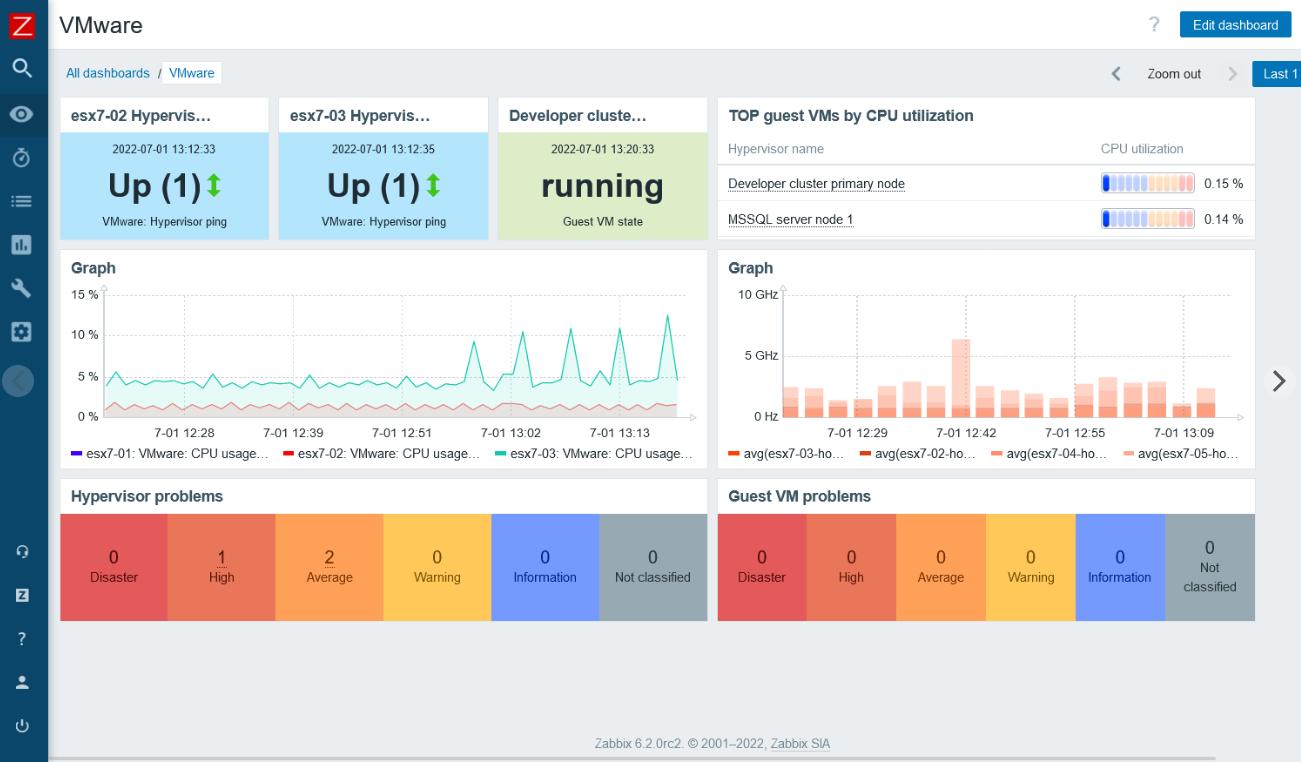
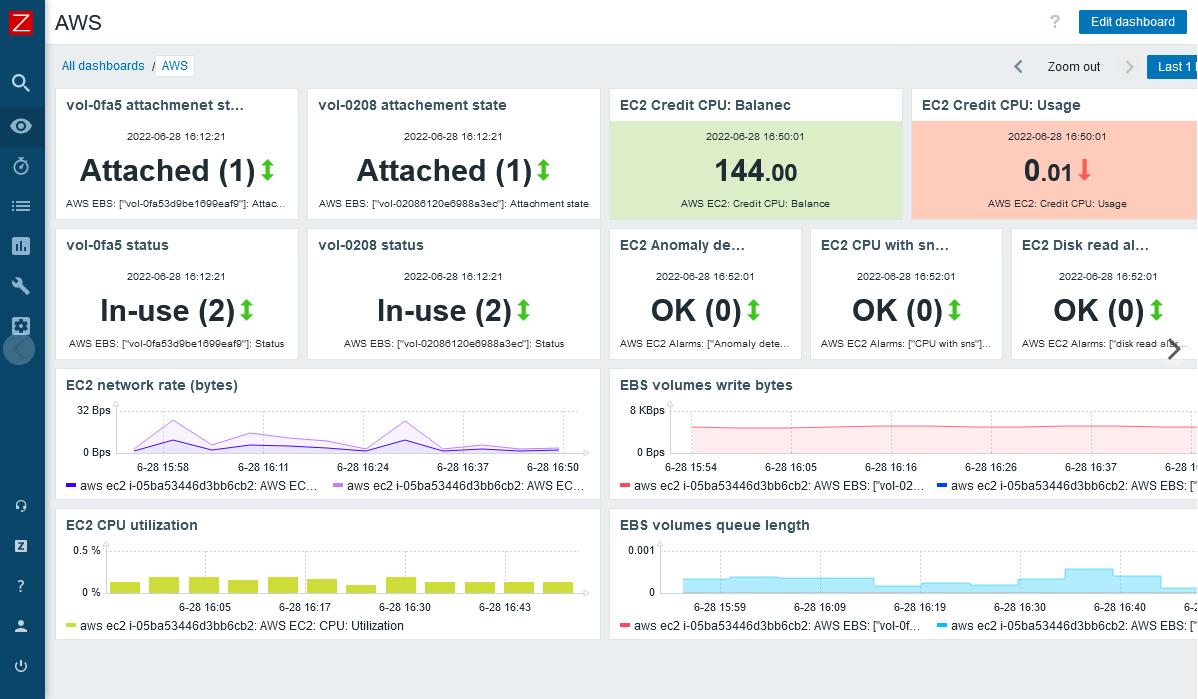
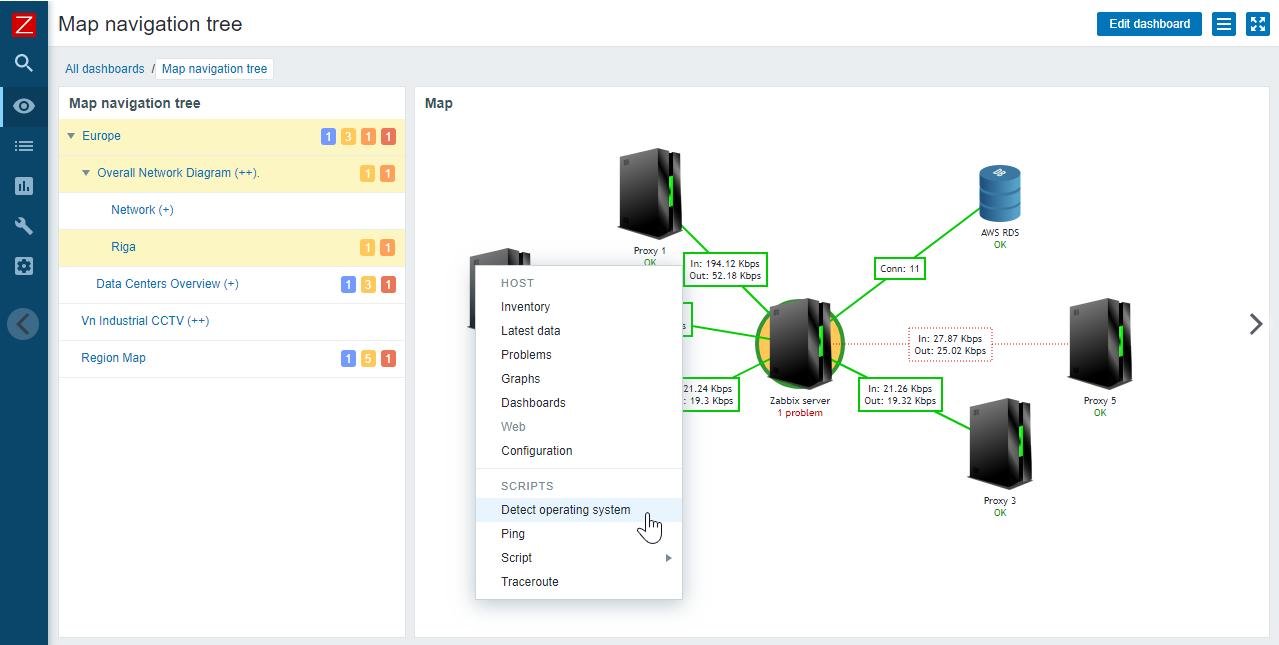
- Visualization: Zabbix provides a variety of options for visualizing data, including graphs, maps, and dashboards. It also has a built-in reporting engine for creating custom reports. Additionally, it supports export and import of data in different formats such as CSV, XML, JSON. It also supports real-time monitoring, with a web-based dashboard that can be accessed from any device.
- Automation: Zabbix supports automation through the use of scripts and integrations with other tools. This makes it easy to automate tasks such as deploying new servers or scaling infrastructure. It also supports web-hooks which allows to trigger external actions. It also has an API that allows to automate tasks such as creating hosts, items, triggers, etc. Additionally, it supports discovery of network devices and services, automatically creating and updating monitoring items.
- Scalability: Zabbix can handle a large number of hosts and metrics, with a distributed architecture that allows to scale horizontally. It also supports high availability, with active-passive cluster and distributed monitoring.
- Flexibility: Zabbix supports a wide range of operating systems and platforms, including Windows, Linux, MacOS, and more. It also supports a variety of agents such as Zabbix agent, SNMP, JMX, IPMI, etc. Additionally, it supports customization of the frontend, with the ability to create custom screens, maps and dashboards.
- Efficiency: Zabbix is optimized for performance, with a low-overhead architecture and efficient data storage. It also supports data compression and data housekeeping to manage historical data.
- Integration: Zabbix supports integration with a variety of third-party tools, including Nagios, PRTG, and Grafana. It also supports integration with external scripts, like Python, Perl, or Shell. Additionally, it supports integration with cloud platforms such as Amazon AWS, Microsoft Azure, and Google Cloud.
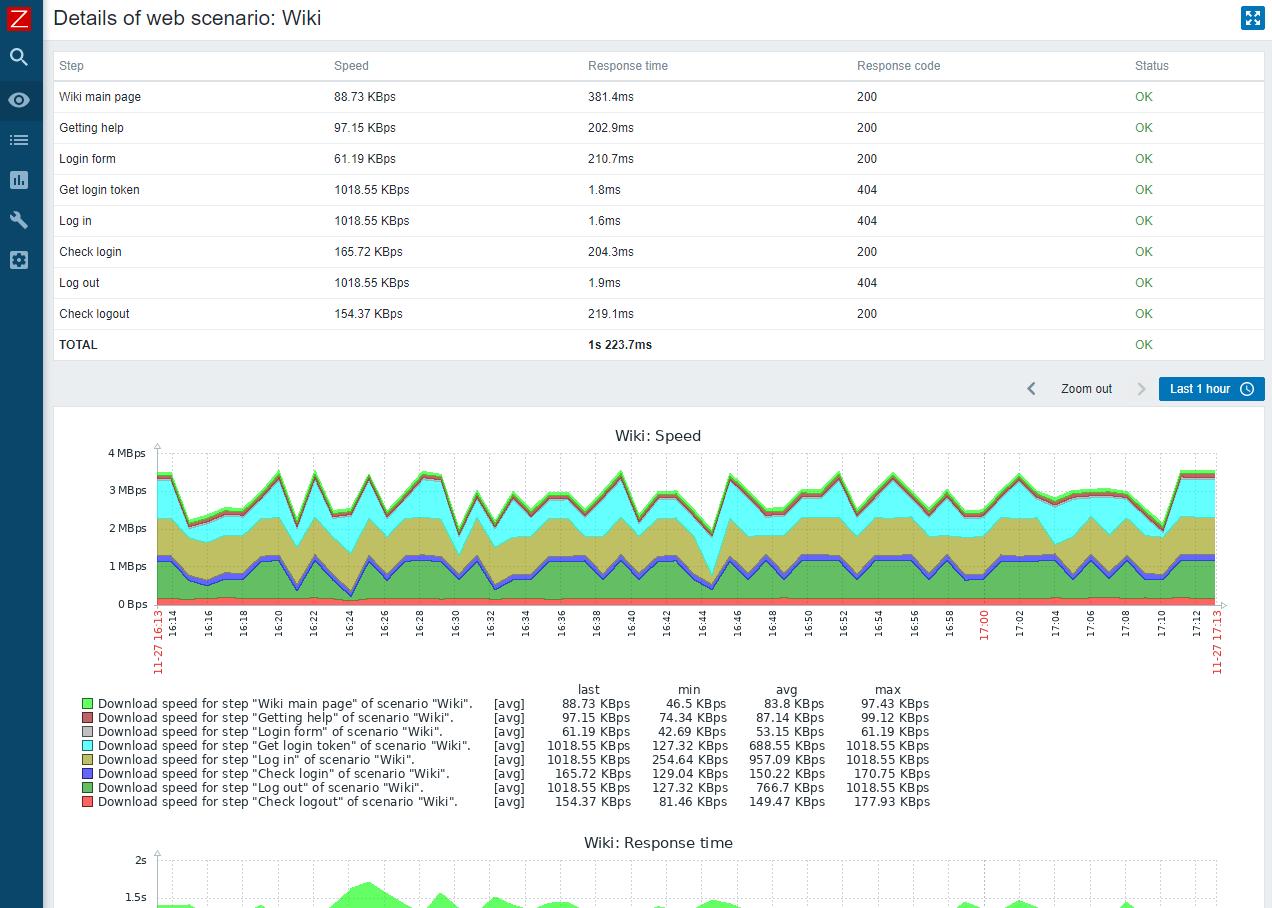
- Extensibility: Zabbix supports the use of custom plugins and scripts, allowing to extend its functionality. It also supports the use of custom alert scripts, allowing to define custom actions based on triggered alerts. Additionally, it supports the use of custom web-scenarios, allowing to define custom checks based on HTTP/HTTPS requests
- Machine Learning: Zabbix supports trend prediction, anomaly detection, baselining using statistical algorithms and machine learning techniques
Overall, Zabbix is a feature-rich monitoring platform that can be used to monitor a wide range of systems and environments. Its support for alerting, visualization, and automation make it a powerful tool for keeping your IT operations running smoothly.
Read more about Zabbix by reading reviews on top review platforms such as: G2, Capterra, TrustRadius.
Need a step-by-step guide for installing Zabbix? You can install it in as little as 10 minutes by following one of these tutorials: CentOS/RHEL, Ubuntu, Debian, Raspberry Pi OS (Rasbian)
Overview of Prometheus
Prometheus is an open-source monitoring and alerting system that was developed specifically to handle the challenges of monitoring dynamic environments like containerized microservice architectures. It has a powerful data model and query language that allows you to easily ask complex questions of your system, and it is designed to be horizontally scalable and highly available.
Some of the key features of Prometheus include:
- Powerful data model and query language: Prometheus has a flexible data model that allows it to store and query a wide range of metrics. Its query language, PromQL, is easy to use and allows you to ask complex questions of your system in a natural way.
- Horizontal scalability: Prometheus is designed to be horizontally scalable, which means that it can handle a large number of targets and a high volume of data without performance degradation.
- High availability: Prometheus is built with high availability in mind and can be configured to run in a highly available setup, ensuring that your monitoring stays up and running even in the event of failures.
- Alerting: Prometheus has built-in alerting capabilities, allowing you to set up alerts based on PromQL queries and receive notifications when certain conditions are met.
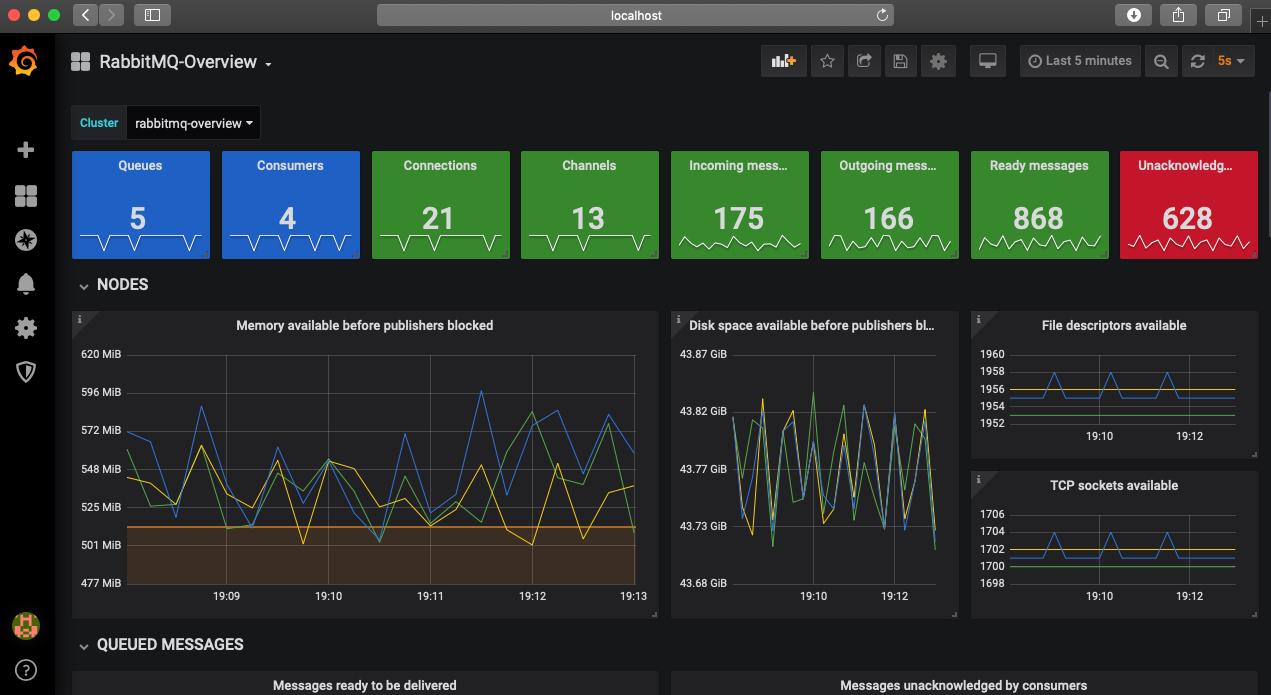
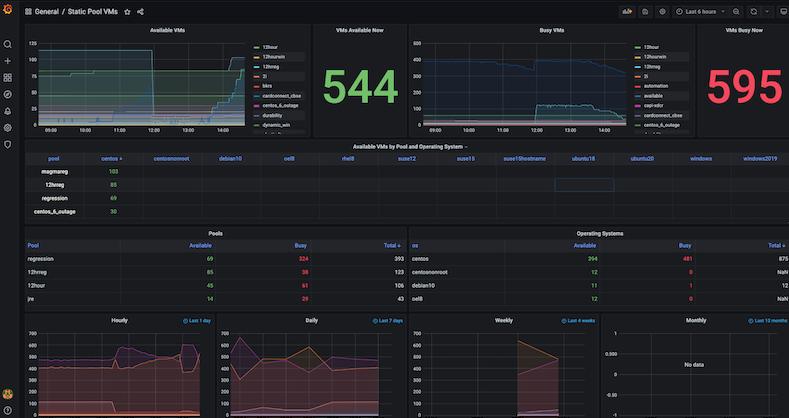
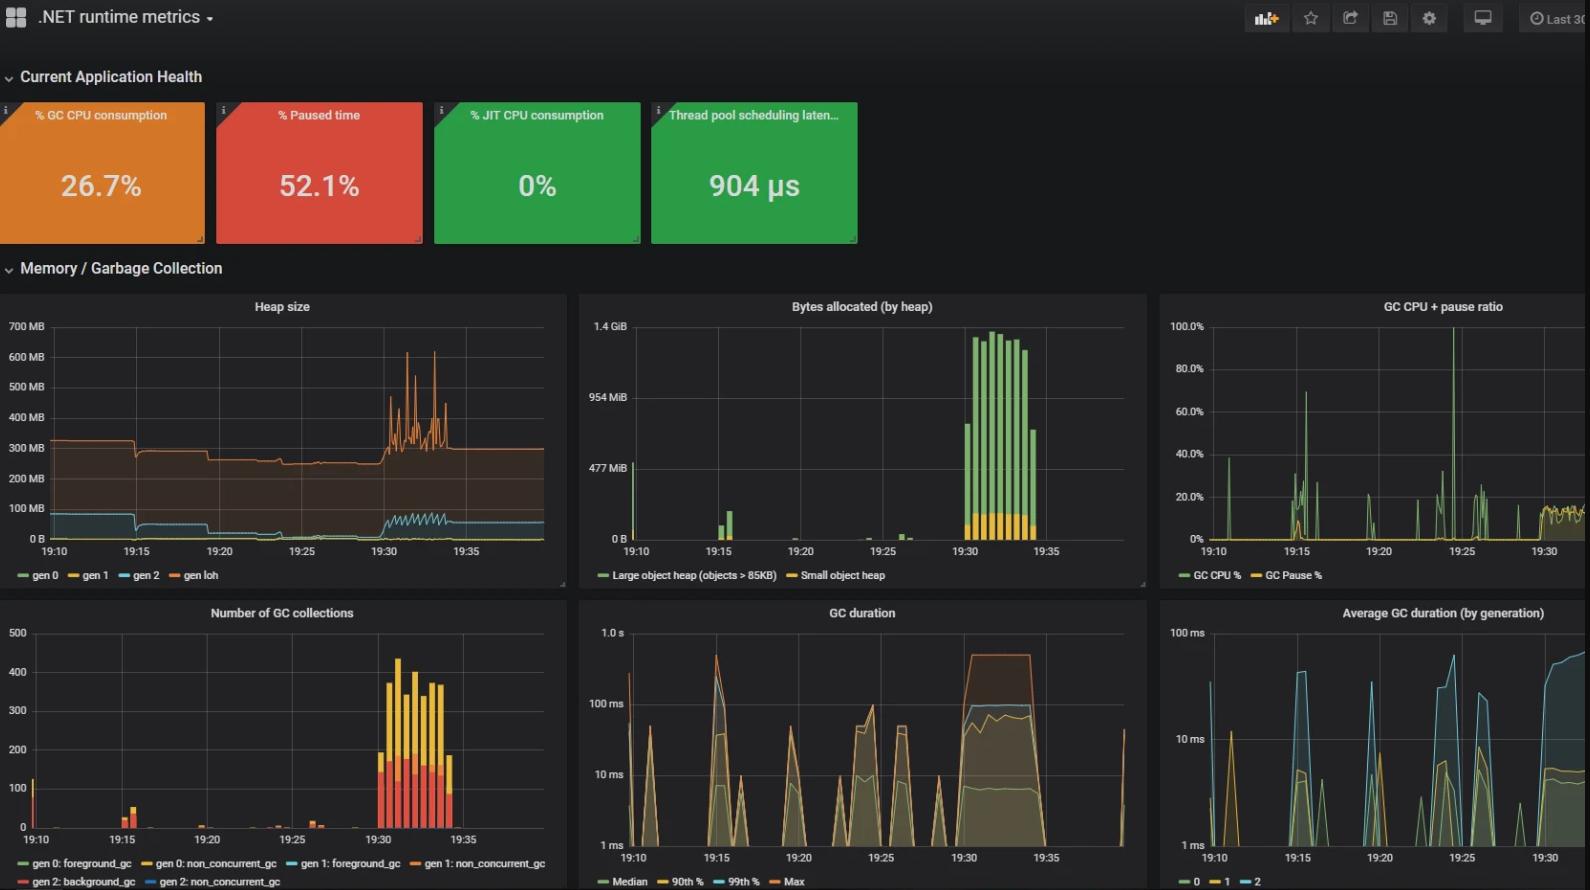
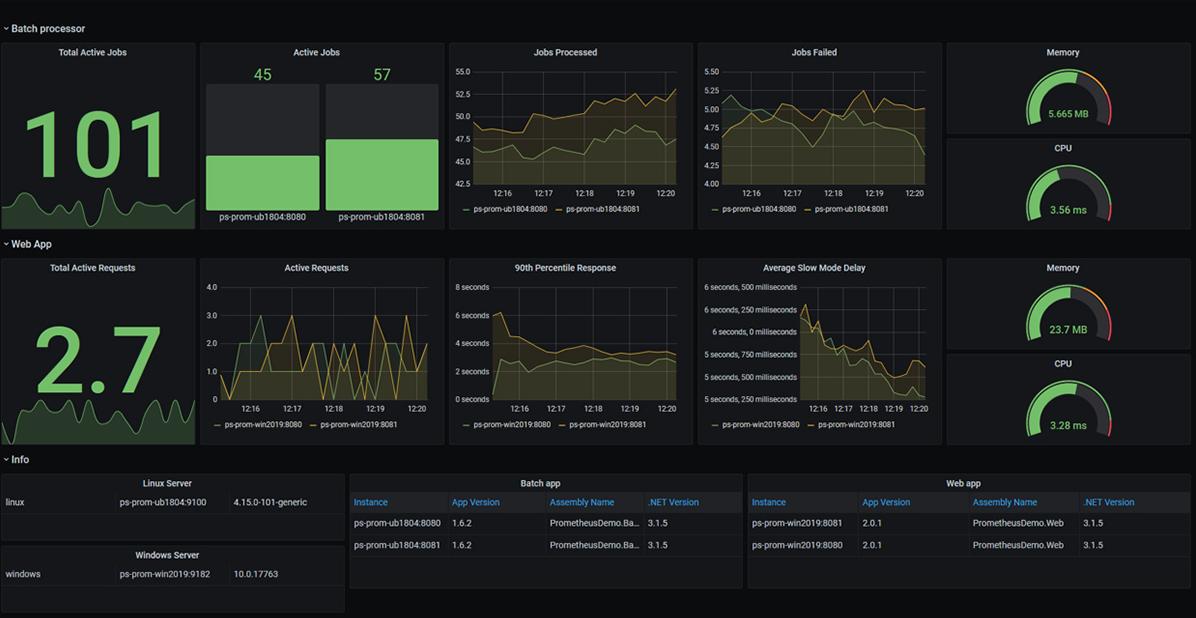
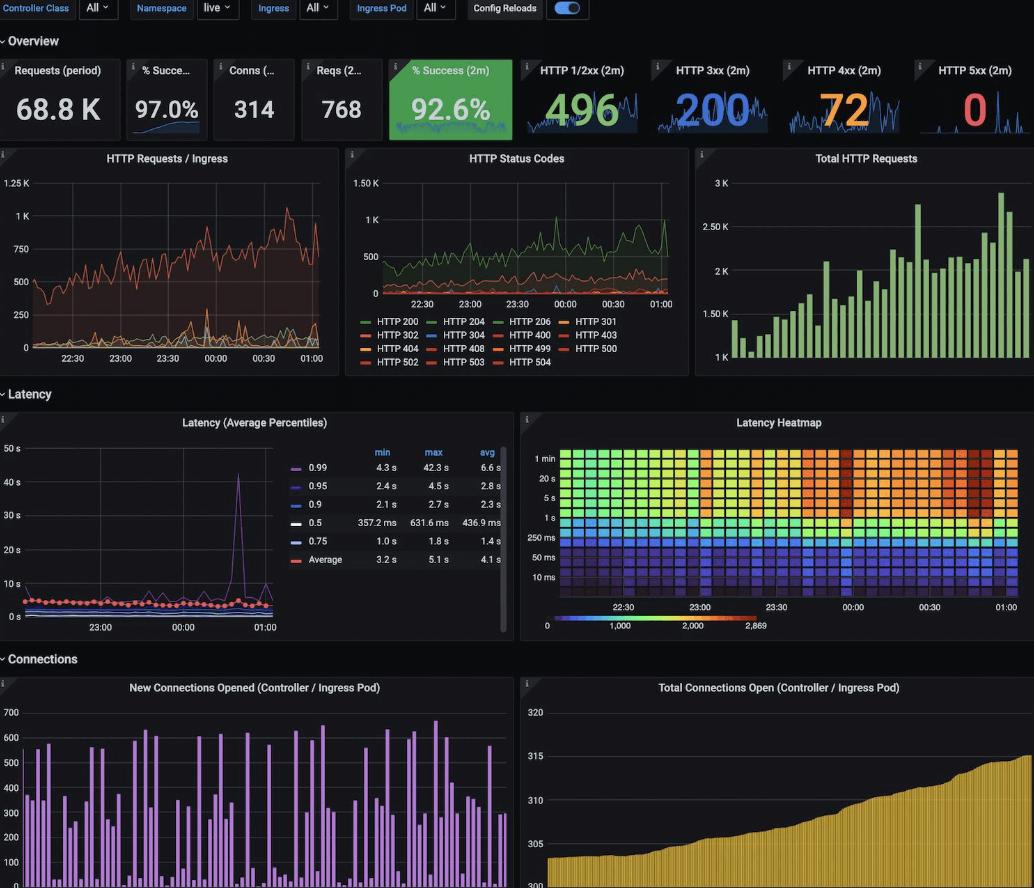
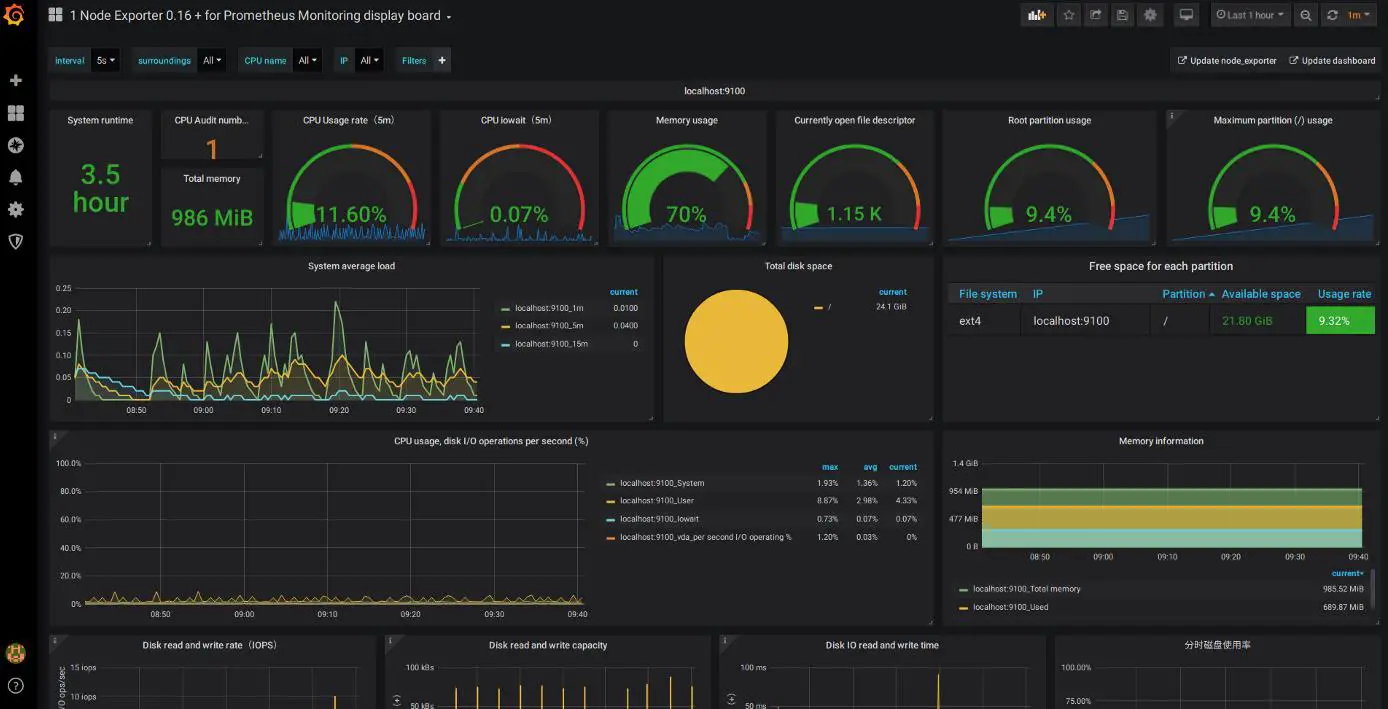
- Grafana integration: Prometheus can be easily integrated with Grafana, a popular open-source visualization tool, to create beautiful and informative dashboards.
Overall, Prometheus is a specialized monitoring and alerting tool that is well-suited for monitoring dynamic environments like containerized microservice architectures. Its powerful data model, query language, and horizontal scalability make it a good choice for large, distributed systems.
Read more about Prometheus by reading reviews on top review platforms such as: G2, Capterra, TrustRadius
Key differences between Zabbix and Prometheus
One of the key differences between Zabbix and Prometheus is the way that they collect data. Zabbix can use either a push or pull model for collecting data, depending on the needs of the environment. In a push setup, the monitored devices send data to the Zabbix server, while in a pull setup, the Zabbix server actively retrieves data from the monitored devices.
Prometheus, on the other hand, is a pull-based system, which means that it actively scrapes data from targets that it is configured to monitor. This makes Prometheus well-suited for environments where the number of targets is constantly changing, such as in a containerized microservice architecture.
Another difference between the two tools is the feature set. Zabbix has a more comprehensive set of features out of the box, including support for visualizing data and creating reports. Prometheus, on the other hand, has a more minimal feature set and relies on a wide ecosystem of tools and integrations to provide additional functionality. To visualize the data collected by Prometheus, you must combine it with other tools such as Grafana, Graphite, and Kibana.
In terms of the types of environments that each tool is best suited for, Zabbix is a good choice for a wide range of systems, including networks, servers, and cloud resources. Prometheus, on the other hand, is particularly well-suited for monitoring dynamic environments like containerized microservices.
Overall, while both Zabbix and Prometheus are powerful monitoring tools, they have different strengths and are best suited for different types of environments.
Use cases for Zabbix and Prometheus
When it comes to choosing a monitoring tool, it’s important to consider the specific needs of your organization. Here are some examples of when you might choose to use Zabbix or Prometheus:
- Use Zabbix if you need a full-featured monitoring platform that can handle a wide range of IT infrastructure. Zabbix is a good choice for organizations that need to monitor traditional IT environments with servers, networks, and other hardware.
- Use Prometheus if you are running a dynamic, containerized microservice architecture. Prometheus was designed specifically for this type of environment and has a powerful data model and query language that is well-suited for monitoring microservices.
- Use Zabbix if you need a tool with a wide range of features out of the box. Zabbix has a comprehensive feature set that includes support for alerting, visualization, and automation.
- Use Prometheus if you prefer a more minimalistic approach and are willing to build out additional functionality through integrations with other tools. Prometheus has a smaller feature set than Zabbix, but it has a strong ecosystem of integrations and tools that can be used to add additional functionality.
Ultimately, the right choice will depend on your specific needs and the requirements of your organization. It’s always a good idea to evaluate both tools and see which one is the best fit for your use case.
Licensing and pricing
When it comes to licensing and pricing, Zabbix and Prometheus have different approaches.
Zabbix is open-source software, which means that it is free to use and distribute. However, the company behind Zabbix, Zabbix SIA, also offers paid services, including support, training, and custom development. These services are typically used by larger organizations that need more advanced monitoring capabilities or want to receive support from the Zabbix team.
Prometheus is also open-source software and is free to use. However, unlike Zabbix, Prometheus does not offer paid versions or support. Instead, it relies on a community-driven model, with contributions from users and sponsors.
Zabbix: Pros and Cons
Pros:
- Wide range of features: Zabbix has a comprehensive set of features for monitoring IT infrastructure, including support for alerting, visualization, and automation.
- Good for large, distributed environments: Zabbix is designed to be horizontally scalable and can handle large amounts of data from distributed systems.
- Flexible architecture: Zabbix can be deployed in a variety of configurations, including on-premises, in the cloud, or as a hybrid solution.
- Good for traditional IT environments: Zabbix is well-suited for monitoring traditional IT environments with servers, networks, and other hardware.
Cons:
- Less well-suited for dynamic environments: Zabbix may be less well-suited for monitoring dynamic environments like containerized microservices, however, this is improving with each new release.
Prometheus: Pros and Cons
Pros:
- Specialized for monitoring dynamic environments: Prometheus was designed specifically for monitoring dynamic environments like containerized microservices and has a powerful data model and query language that is well-suited for this type of environment.
- Horizontally scalable: Prometheus is designed to be horizontally scalable, making it a good choice for large, distributed systems.
- Free and open-source: Prometheus is free to use and is open-source, with a strong community of users and developers.
Cons:
- Limited feature set: Prometheus has a more limited feature set compared to Zabbix and relies on integrations with other tools to add additional functionality.
- May require more configuration: Because Prometheus has a more minimalistic approach, it may require more configuration and setup to get it up and running.
- Not as well-suited for traditional IT environments: Prometheus is not as well-suited for monitoring traditional IT environments with servers, networks, and other hardware.
Conclusion
When it comes to choosing a monitoring tool, it’s important to consider the specific needs of your organization. Here are some examples of when you might choose to use Zabbix or Prometheus:
- Use Zabbix if you need a full-featured monitoring platform that can handle a wide range of IT infrastructure. Zabbix is a good choice for organizations that need to monitor traditional IT environments with servers, networks, and other hardware.
- Use Prometheus if you are running a dynamic, containerized microservice architecture. Prometheus was designed specifically for this type of environment and has a powerful data model and query language that is well-suited for monitoring microservices.
- Use Zabbix if you need a tool with a wide range of features out of the box. Zabbix has a comprehensive feature set that includes support for alerting, visualization, and automation.
- Use Prometheus if you prefer a more minimalistic approach and are willing to build out additional functionality through integrations with other tools. Prometheus has a smaller feature set than Zabbix, but it has a strong ecosystem of integrations and tools that can be used to add additional functionality.
Ultimately, the right choice will depend on your specific needs and the requirements of your organization. It’s always a good idea to evaluate both tools and see which one is the best fit for your use case.
This is a very good article, which introduces the difference between Zabbix and Prometheus in detail.
I asked a lot of people, most of them said their difference is: Zabbix dashboard is ugly, Prometheus is cool (actually grafana)
In fact, zabbix can also use grafana to show a cool dashboard
So most people actually don’t know the difference, they just follow the trend