I’ve put together a comprehensive list of the best monitoring tools for network, system, application, and log management. It includes both free (open-source) and commercial monitoring software. I plan to expand this list every week with the aim of covering 100 monitoring systems. My goal is to provide you with all the relevant information you need to make an informed decision, such as the popularity (number of web visits per month), license type, review links, wiki, social links, etc.
I also want to describe the software as accurately as possible in a few sentences, so please suggest better descriptions in the comments. All the tools on this list will be sorted by popularity.
01. Datadog
Datadog is an observability service for cloud-scale applications, providing monitoring of servers, databases, tools, and services, through a SaaS-based data analytics platform.Links Web, Wiki, Twitter, Youtube Licence Commercial Visits/Month 4 250 000 Reviews G2, Capterra, TrustRadius 
02. Zabbix
Zabbix is an open-source monitoring tool that is designed to track and monitor various aspects of your network infrastructure, including servers, applications, and network devices. It is a powerful tool that offers a wide range of features and functionalities, including real-time monitoring, data collection, alerting, and reporting.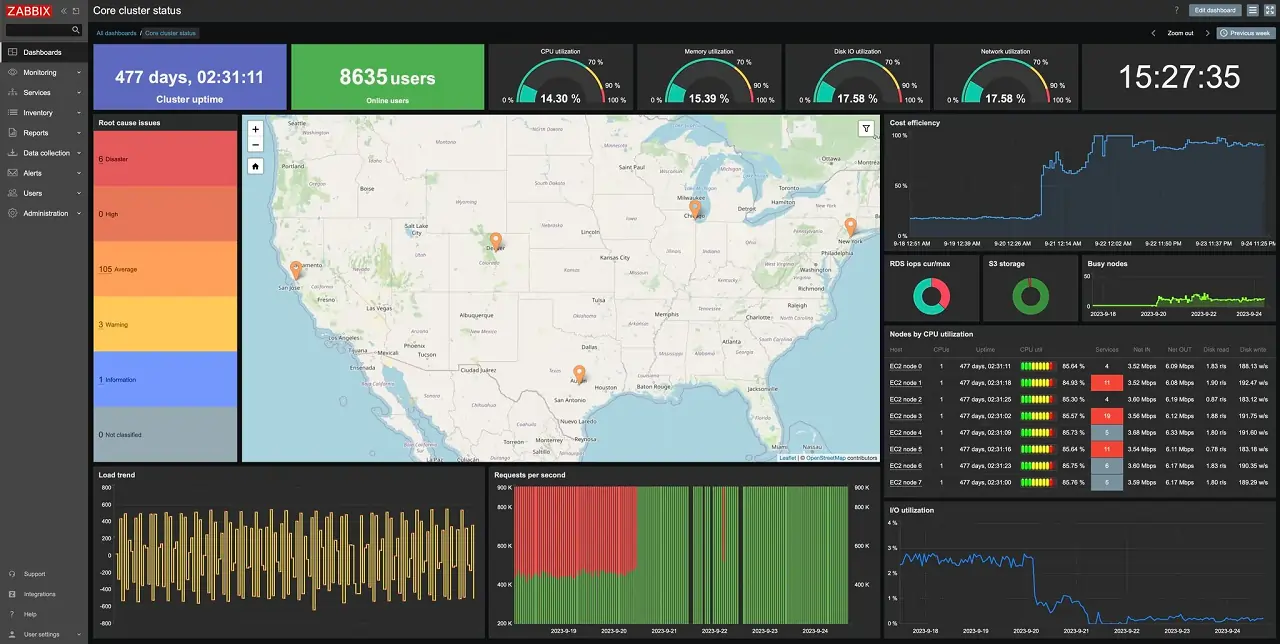
03. PRTG
PRTG Network Monitor is a network monitoring software developed by Paessler AG. It is used to monitor and analyze various aspects of a network, including traffic, performance, Netflow and availability of network devices and services. It can also be used to monitor cloud services, servers, and applications. PRTG uses sensors to collect data, and users can set up alerts and notifications based on this data. It is available in a free version, as well as various paid versions with additional features.Links Web, Wiki, Twitter, Youtube Licence Commercial / Limited Free Visits/Month 700 000 Reviews G2, Capterra, TrustRadius 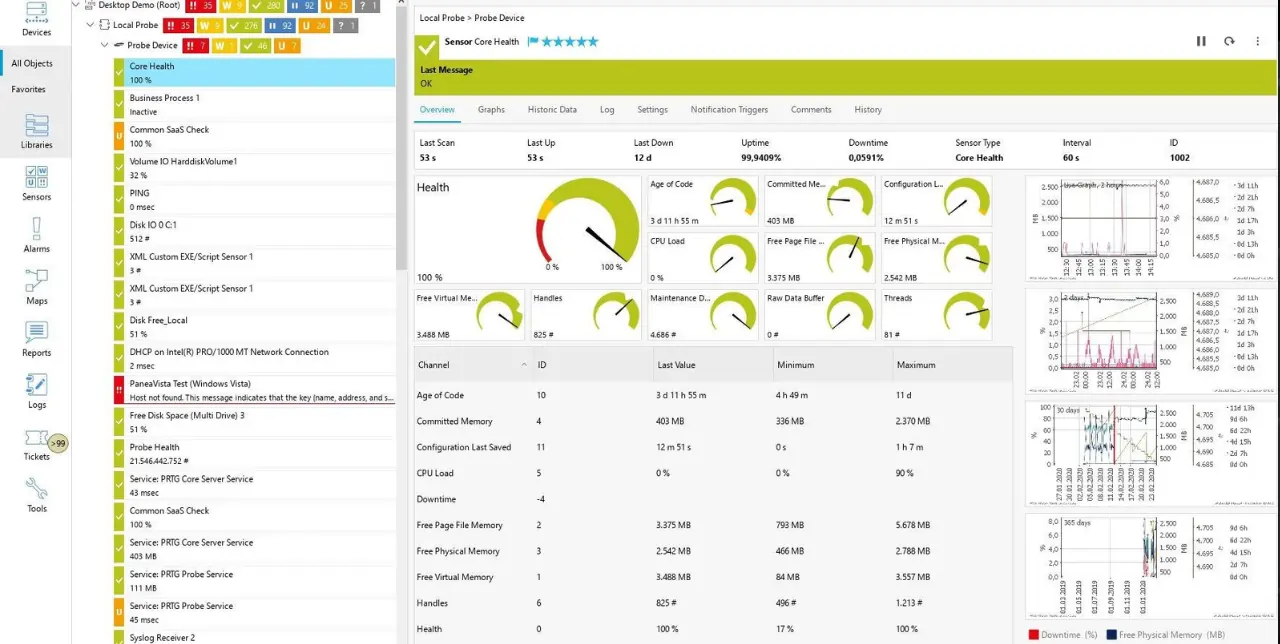
04. Prometheus
Prometheus is an open-source monitoring and alerting system that was developed specifically to handle the challenges of monitoring dynamic environments like containerized microservice architectures. It has a powerful data model and query language that allows you to easily ask complex questions of your system, and it is designed to be horizontally scalable and highly available.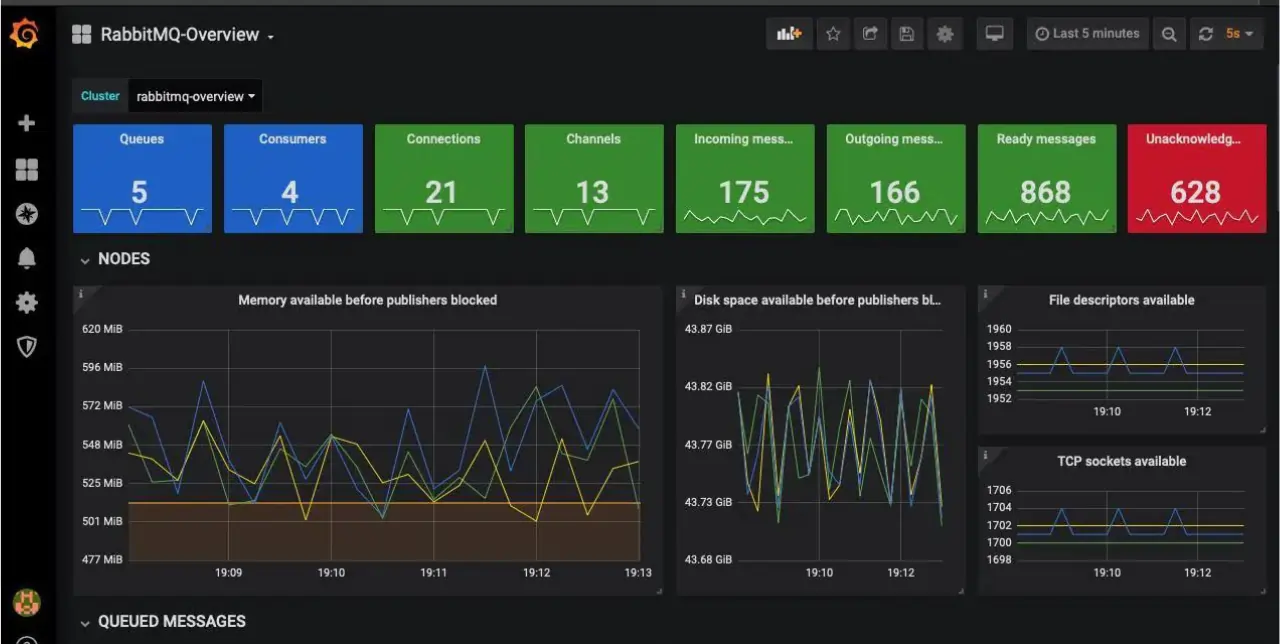
05. Netdata
Netdata is different. Real-Time data collection and visualization. Infinite scalability baked into its design. Flexible and extremely modular. Immediately available for troubleshooting, requiring zero prior knowledge and preparation. Open to be integrated to existing monitoring tool chains like Prometheus and Grafana, Graphite, OpenTSDB, InfluxDB, or even third party commercial solutions.Links Web, Wiki, Twitter, Youtube Licence Commercial / Limited Free Visits/Month 260 000 Reviews G2, Capterra, TrustRadius 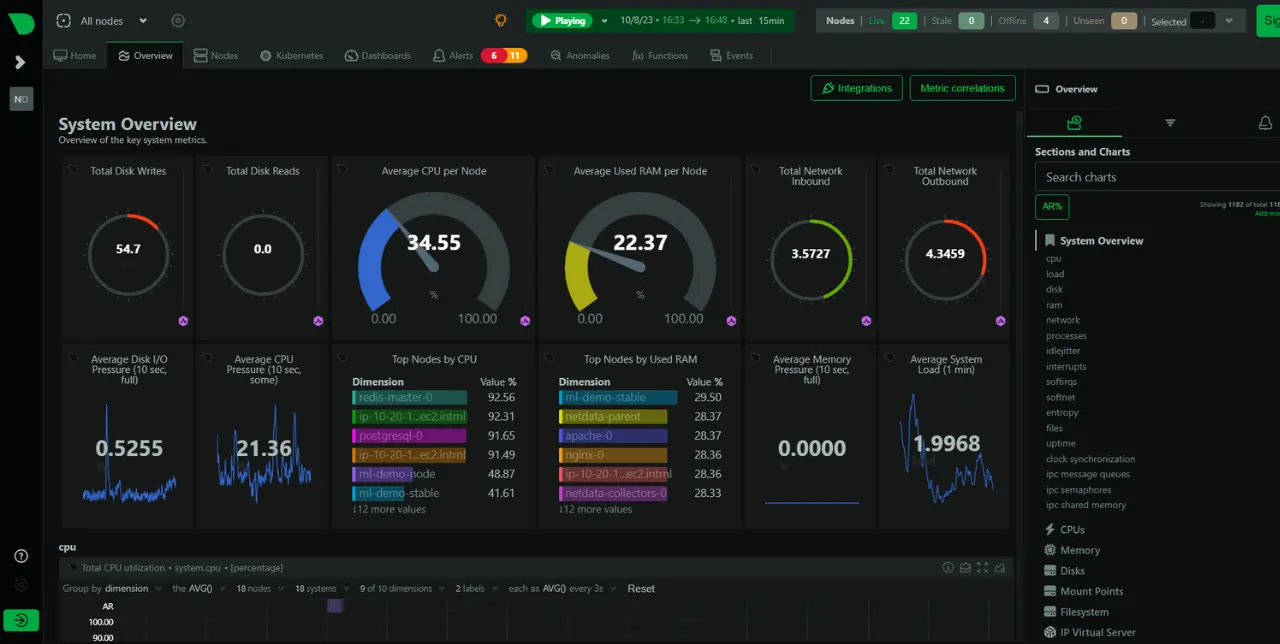
06. Checkmk
Checkmk is a leading tool for Infrastructure and Application Monitoring. Simple configuration, scalable, flexible. Open Source and Enterprise.Links Web, Wiki, Twitter, Youtube Licence Commercial / Limited Free Visits/Month 240 000 Reviews G2, Capterra, TrustRadius 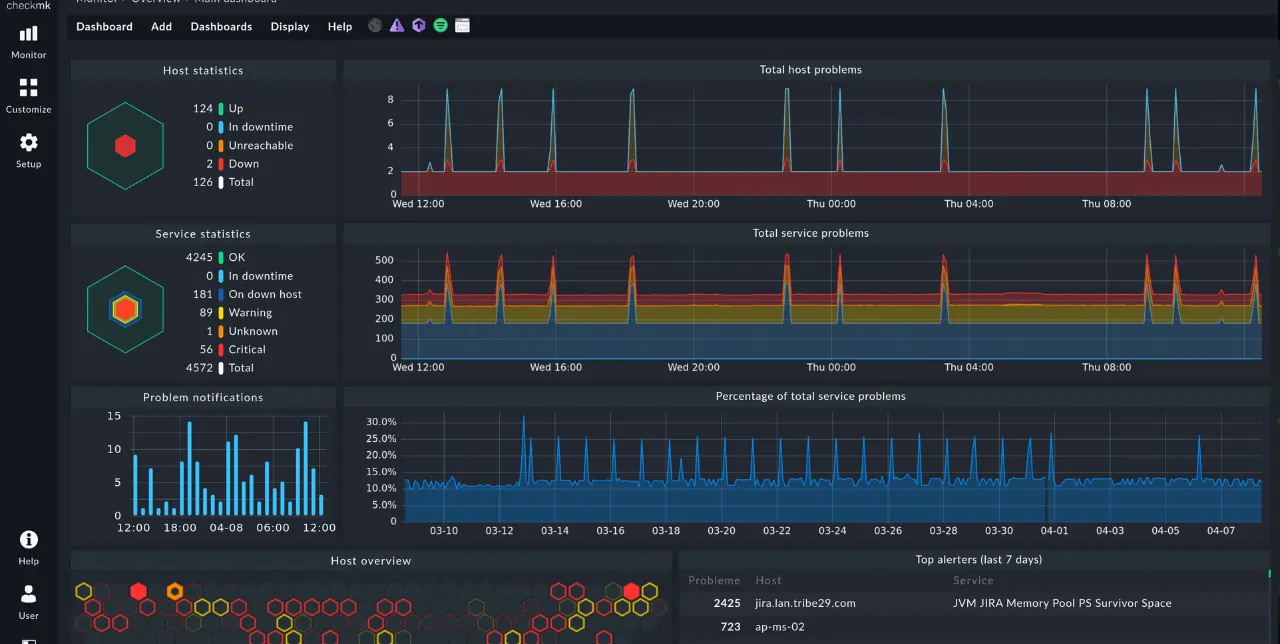
07. PandoraFMS
PandoraFMS is the all-in-one flexible monitoring solution that covers networks, servers, applications, UX, distributed environments, business processes and more.Links Web, Wiki, Twitter, Youtube Licence Commercial / Limited Free Visits/Month 140 000 Reviews G2, Capterra, TrustRadius 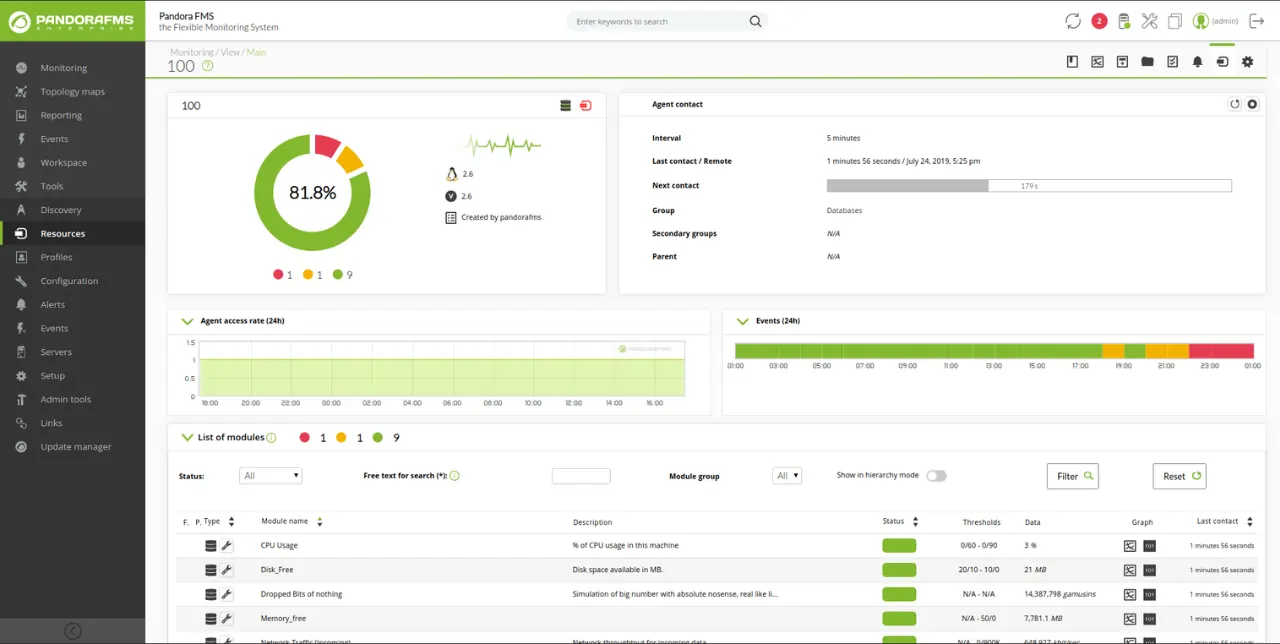
08. Nagios
Nagios Core is an open-source, free system and network monitoring application that monitors the hosts and services you specify, alerting you when things go wrong and when they improve. Nagios XI is a commercial upgrade of Nagios Core that provides monitoring of all mission-critical infrastructure components, including applications, services, operating systems, network protocols, system metrics, and network infrastructure. Hundreds of third-party add-ons provide monitoring for virtually all internal and external applications, services, and systems.Links Web, Wiki, Twitter, Youtube Licence Commercial / Limited Free Visits/Month 110 000 Reviews G2, Capterra, TrustRadius 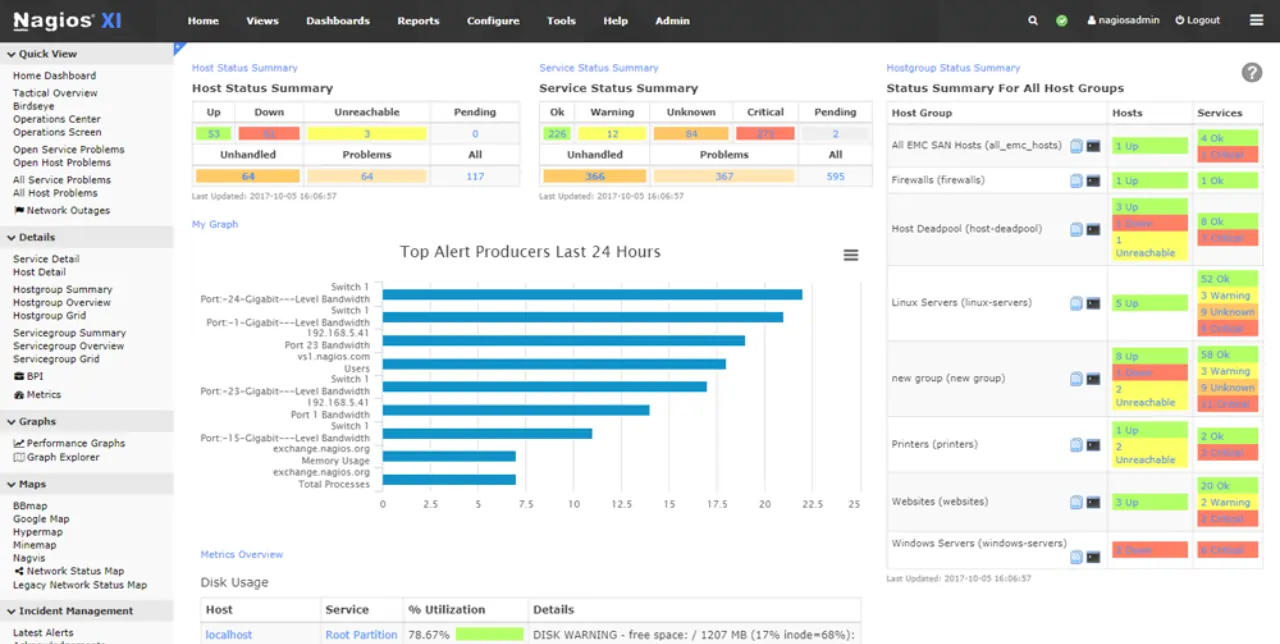
09. LibreNMS
LibreNMS is a free and open-source network monitoring software designed for managing large and complex networks. It allows network administrators to monitor and manage devices, servers, switches, routers, and more from a single, centralized platform. LibreNMS provides features such as performance monitoring, alerts, reporting, and inventory management. It is built on PHP and utilizes technologies such as SNMP, RRDTool, and MySQL to provide a powerful and flexible monitoring solution.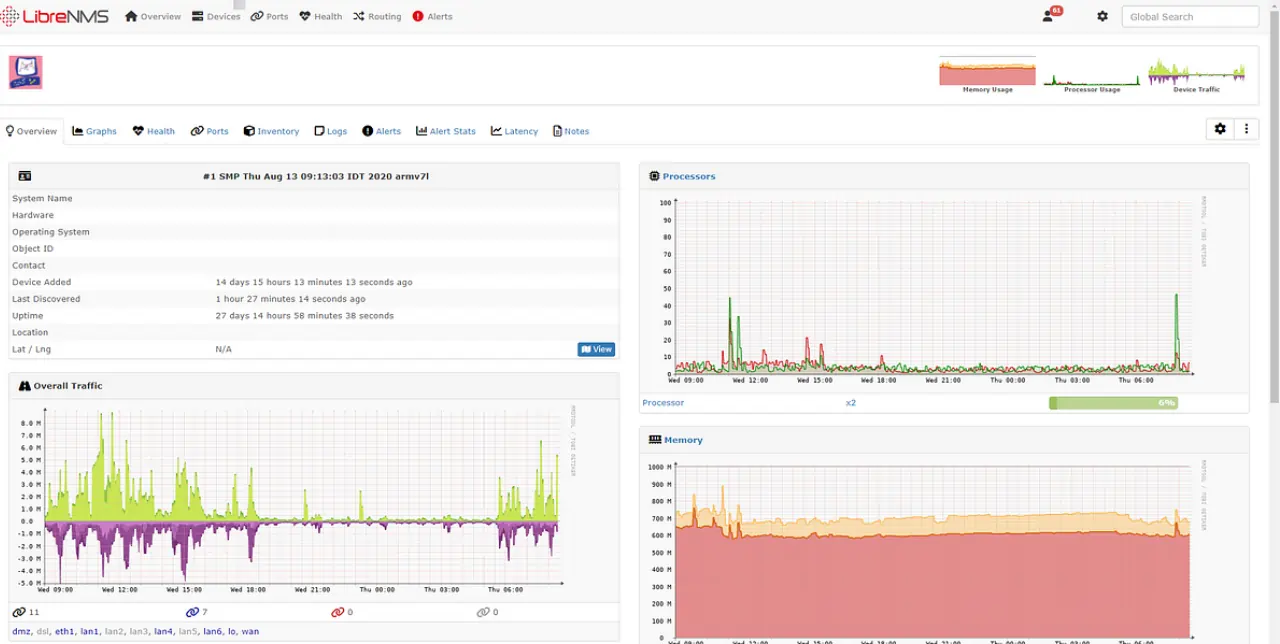
10. Cacti
Cacti includes a fully distributed and fault tolerant data collection framework, advanced template based automation features for Devices, Graphs and Trees, multiple data acquisition methods, the ability to be extended through Plugins, Role based User, Group and Domain management features in addition to a theming engine and multiple language support all right out of the box. All of this is wrapped in an intuitive, easy to use interface that makes sense for LAN-sized installations up to complex networks with tens of thousands of devices.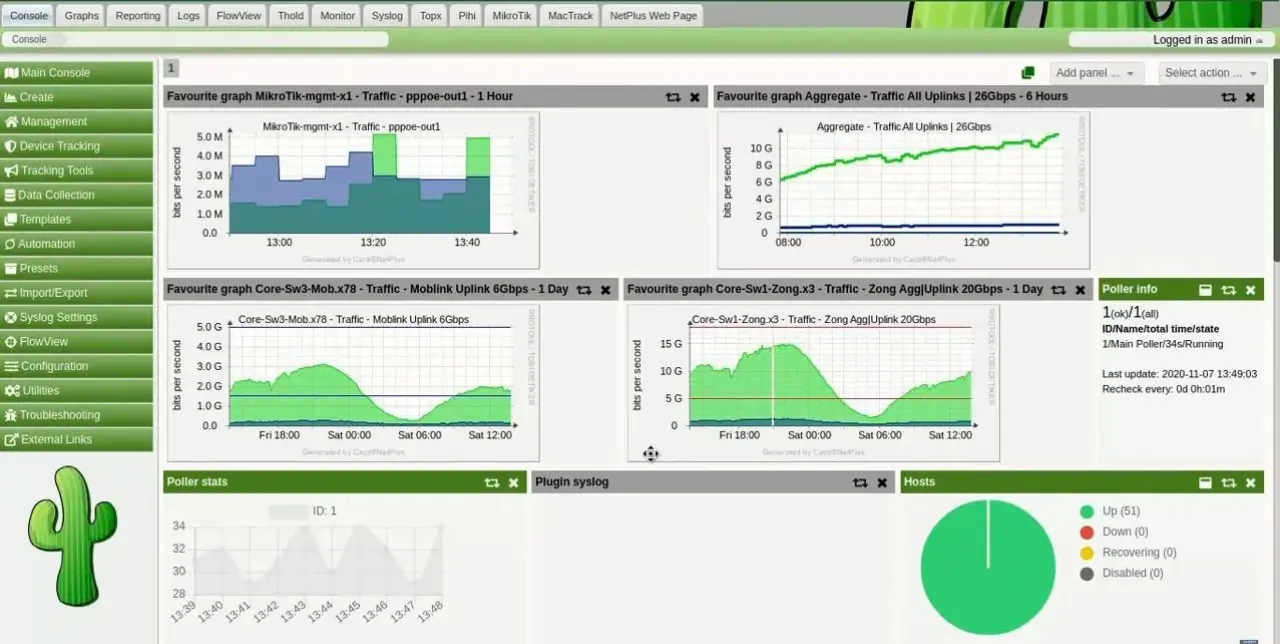
11. ScienceLogic
ScienceLogic is a cloud-based IT operations management platform that provides businesses with a unified view of their IT infrastructure and applications. It helps organizations manage their IT operations, monitor and troubleshoot issues, and automate operations. ScienceLogic provides a centralized platform for monitoring devices, applications, virtual and cloud infrastructures, and more. It offers features such as real-time monitoring, predictive analytics, event correlation, and reporting. ScienceLogic is designed to be used by IT operations teams and is used by organizations of all sizes, from small businesses to large enterprises.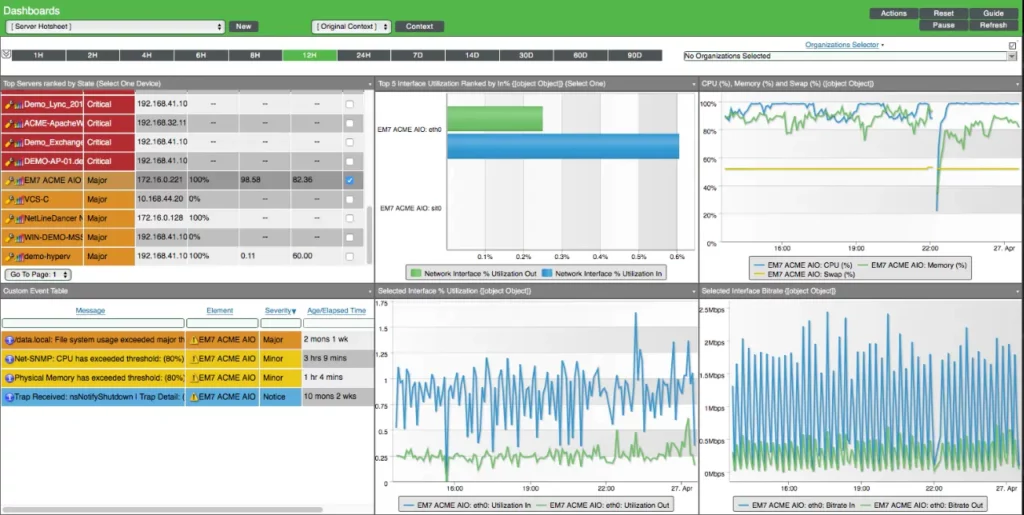
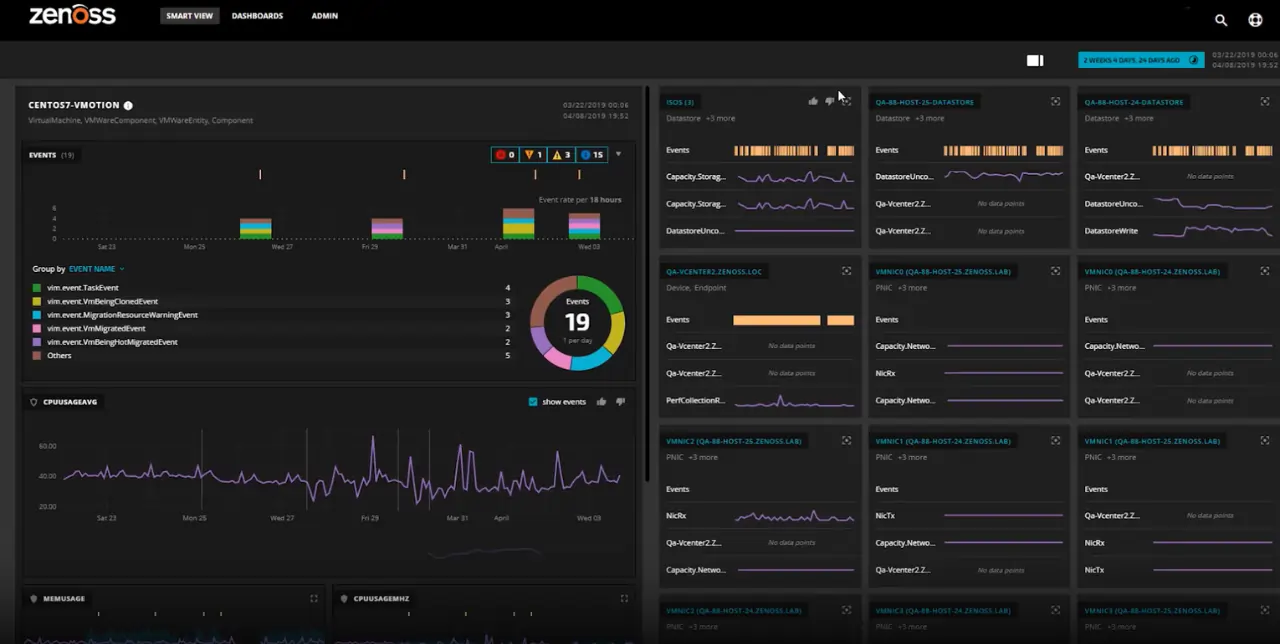
12. Zenoss
Zenoss Cloud is a SaaS-based solution that provides deep infrastructure monitoring for your hybrid IT environment, at any scale. It collects all types of machine data, and builds real-time IT service models that train machine learning algorithms to predict and eliminate outages in hybrid IT environments. The main benefit, according to the vendor, is to dramatically reduce downtime and IT spend.Links Web, Wiki, Twitter, Youtube Licence Commercial / Limited Free Visits/Month 40 000 Reviews G2, Capterra, TrustRadius