Zabbix and Checkmk are monitoring tools that share many similarities. Both aim to be universal monitoring solutions with impressive visualization capabilities and a wide range of features. However, the question remains: which one is better option for you?
| Name | Links | Licence | Visits / Month | Reviews |
| Zabbix | Wiki, Twitter, Youtube | Free | 750 000 | G2, Capterra, TrustRadius |
| Checkmk | Wiki, Twitter, Youtube | Commercial / Limited Free | 240 000 | G2, Capterra, TrustRadius |
Table of Contents
Overview of Zabbix
Zabbix is a robust 100% free open-source monitoring solution designed to track and manage the health and performance of various IT components. With its scalable architecture, Zabbix enables real-time monitoring, alerting, and visualization of metrics across networks, servers, applications, and more. It boasts an intuitive web interface, support for various data collection methods, and a wide range of predefined templates for quick setup.
Some of the key features of Zabbix include:
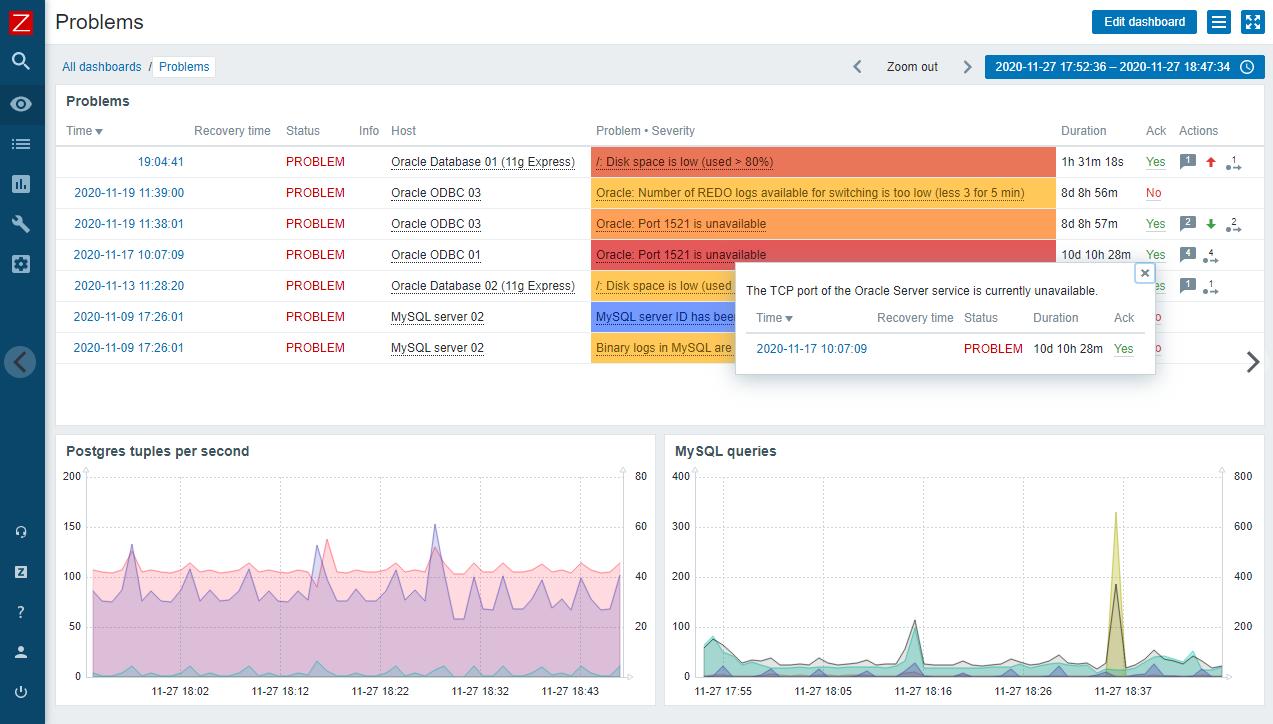
- Alerting: Zabbix has a comprehensive alerting system that can send notifications via email, SMS, or other channels when issues arise. It also supports event correlation, which allows to analyze and filter multiple events, reducing the number of false alarms. Additionally, it has a flexible alerting mechanism that allows to define multiple media types (email, sms, Jabber, etc) and alert scripts.
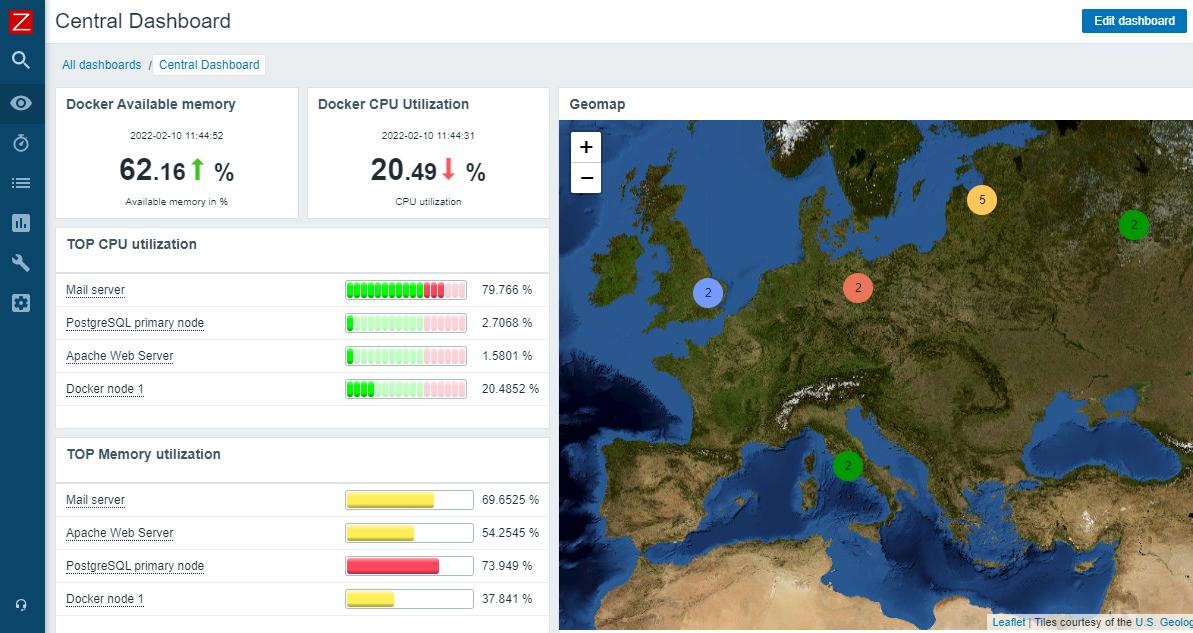
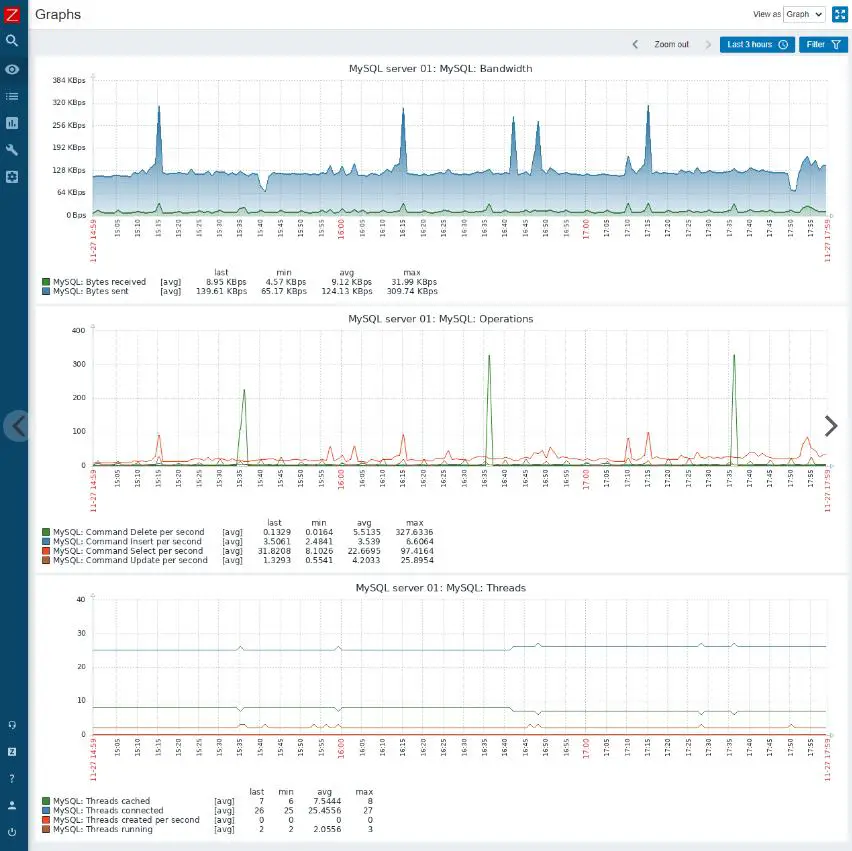
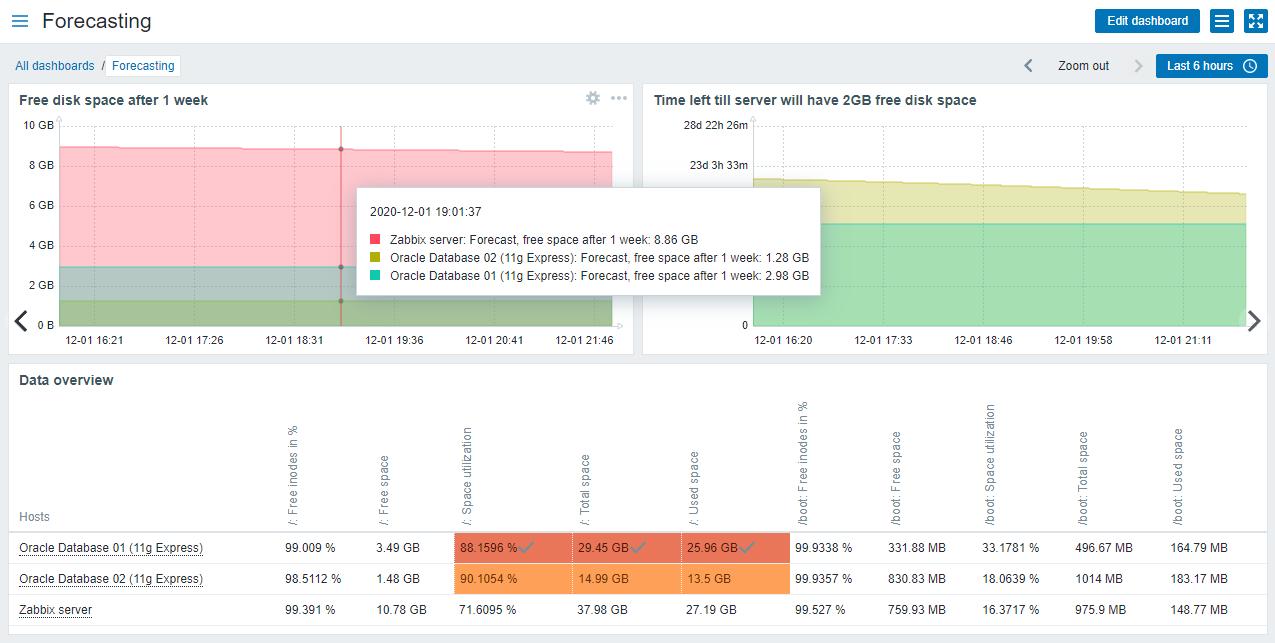
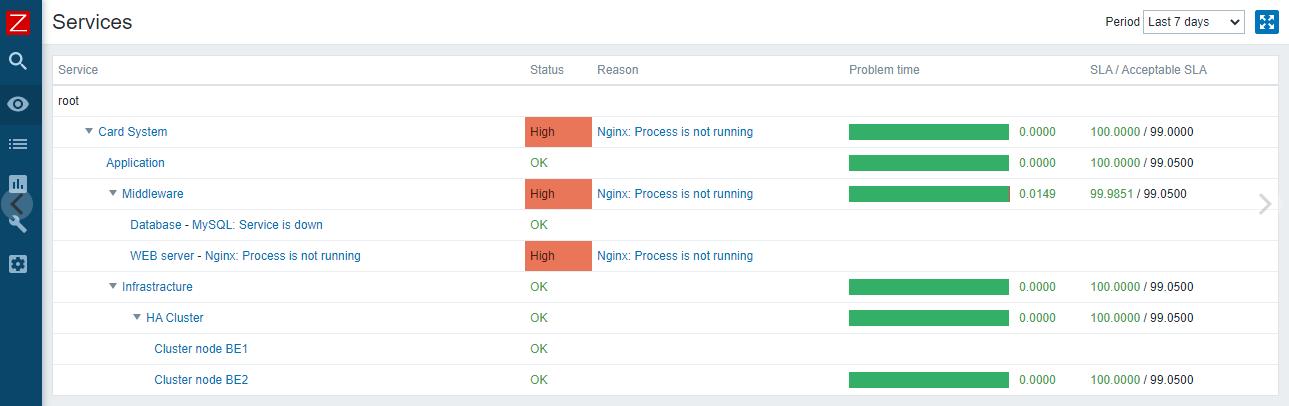
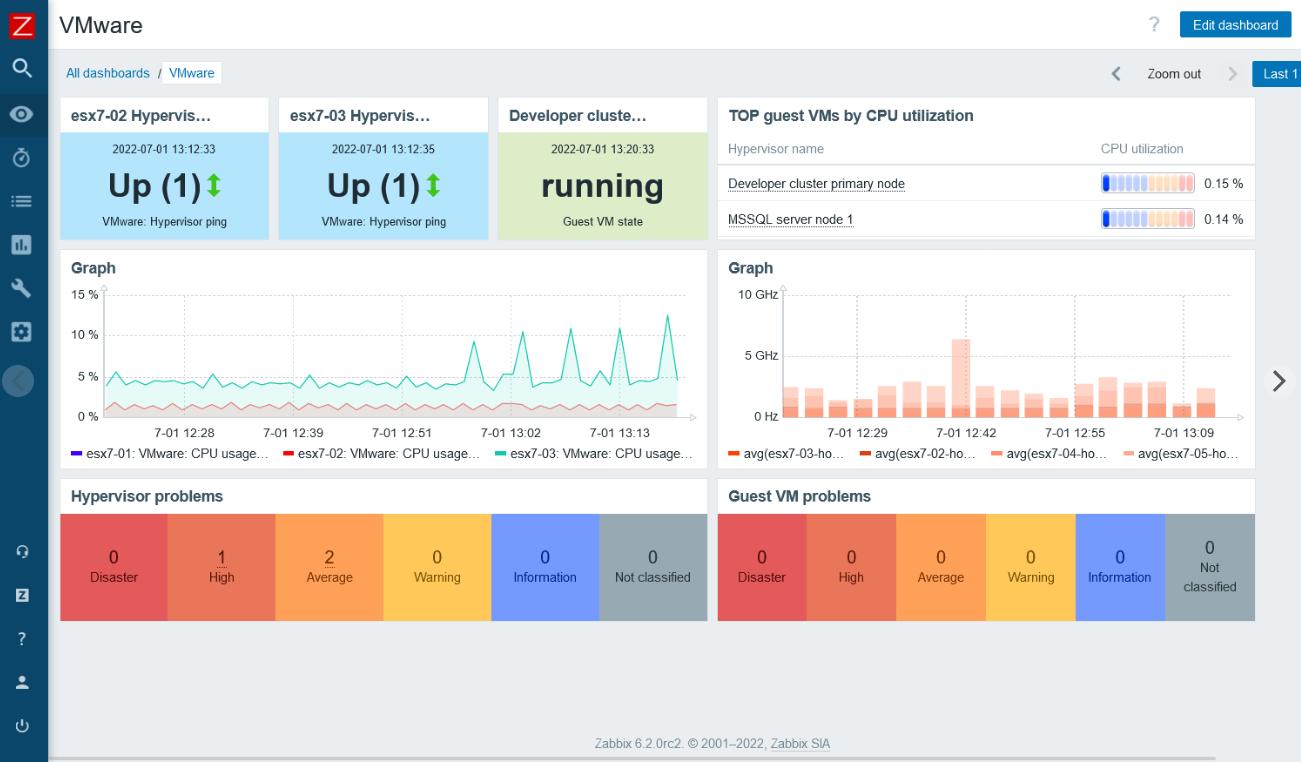
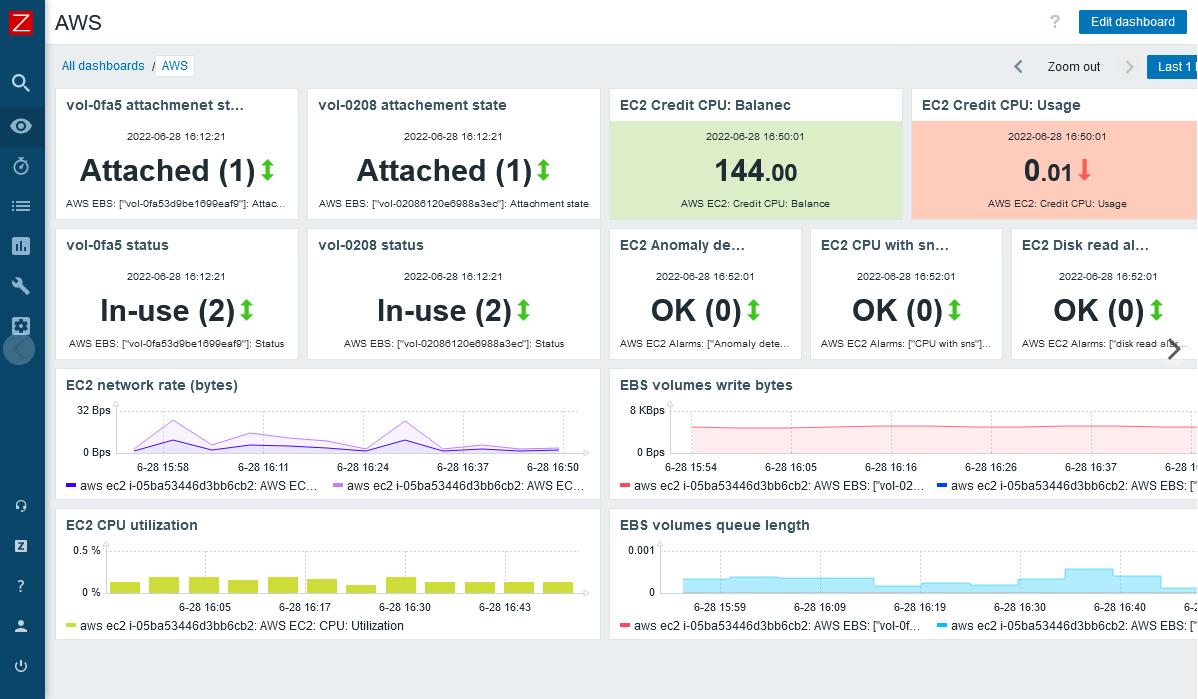
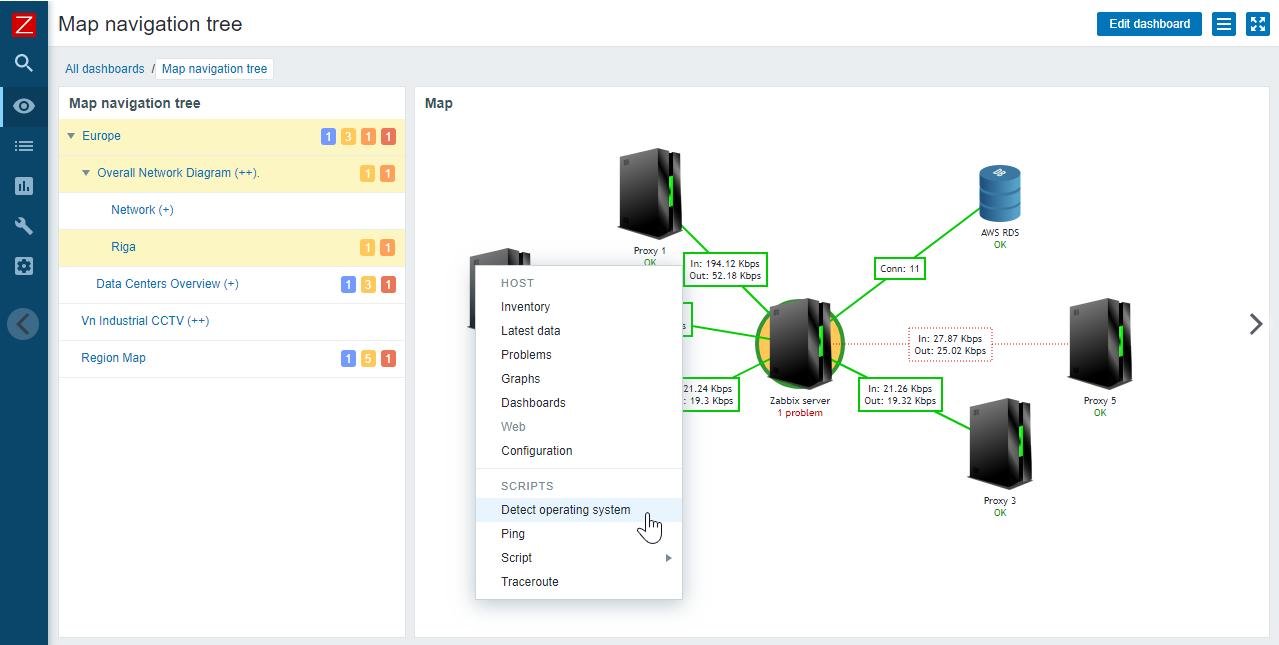
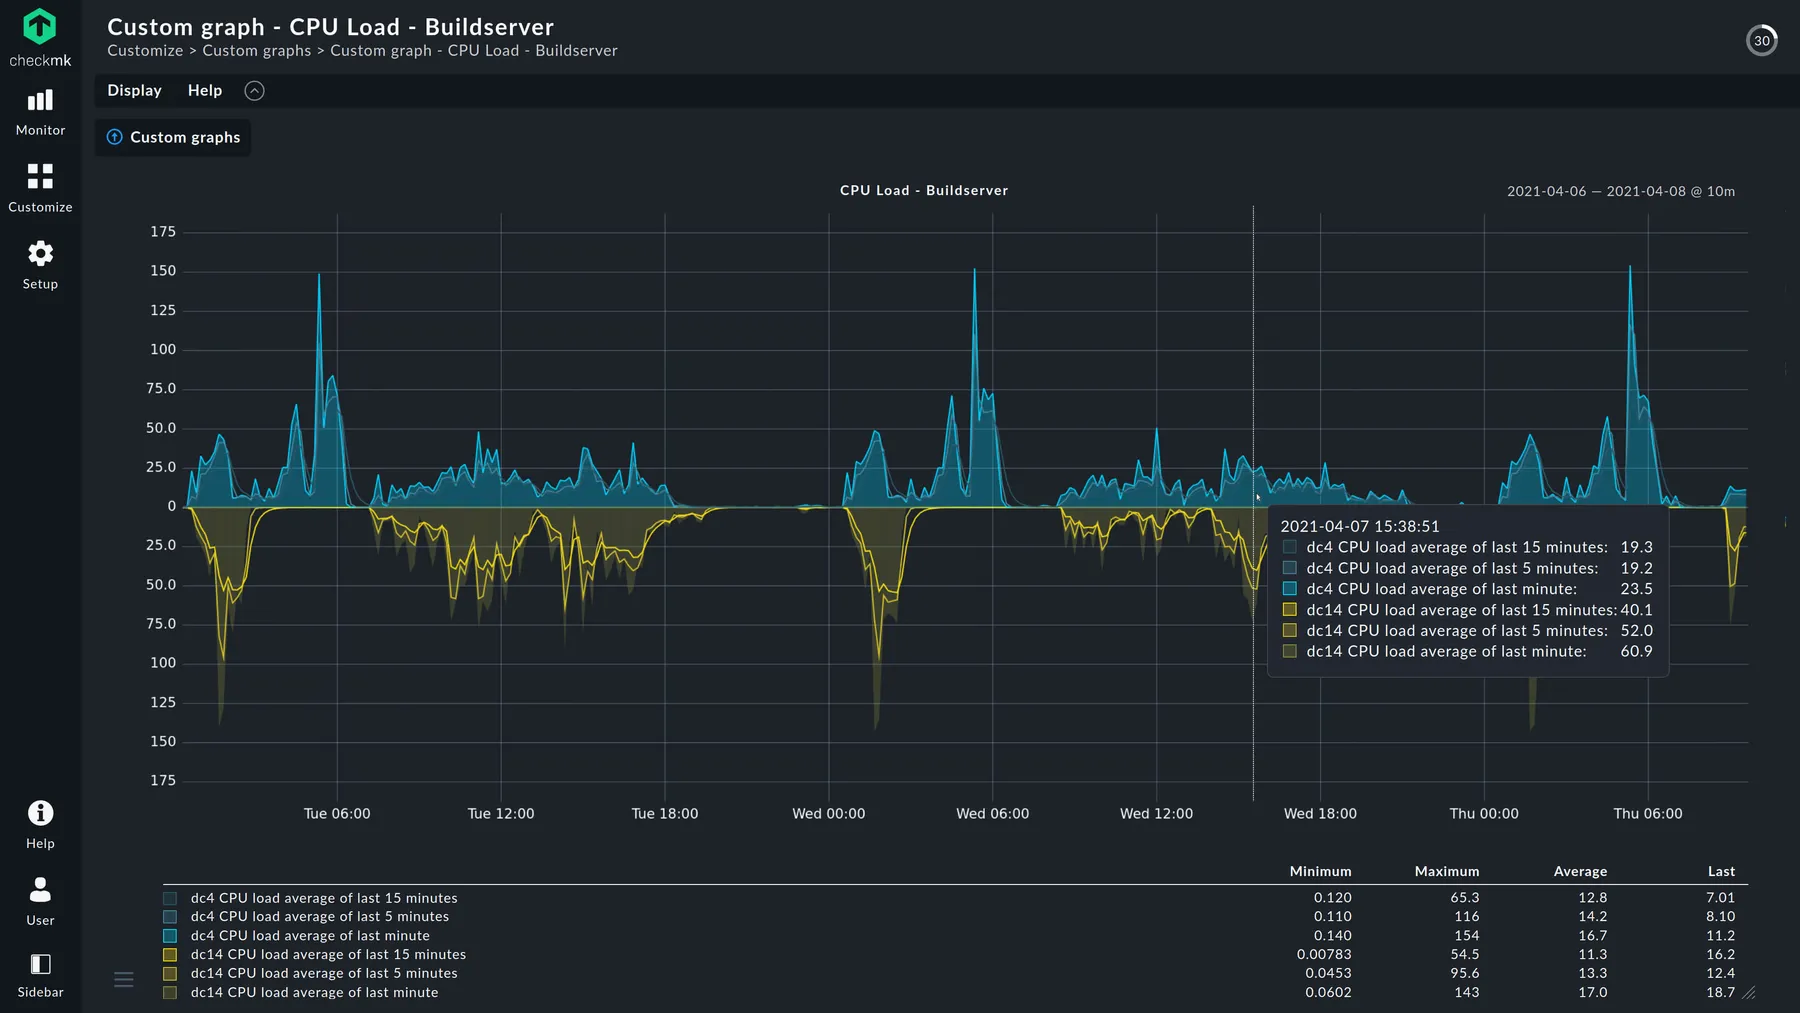
- Visualization: Zabbix provides a variety of options for visualizing data, including graphs, maps, and dashboards. It also has a built-in reporting engine for creating custom reports. Additionally, it supports export and import of data in different formats such as CSV, XML, JSON. It also supports real-time monitoring, with a web-based dashboard that can be accessed from any device.
- Automation: Zabbix supports automation through the use of scripts and integrations with other tools. This makes it easy to automate tasks such as deploying new servers or scaling infrastructure. It also supports web-hooks which allows to trigger external actions. It also has an API that allows to automate tasks such as creating hosts, items, triggers, etc. Additionally, it supports discovery of network devices and services, automatically creating and updating monitoring items.
- Scalability: Zabbix can handle a large number of hosts and metrics, with a distributed architecture that allows to scale horizontally. It also supports high availability, with active-passive cluster and distributed monitoring.
- Flexibility: Zabbix supports a wide range of operating systems and platforms, including Windows, Linux, MacOS, and more. It also supports a variety of agents such as Zabbix agent, SNMP, JMX, IPMI, etc. Additionally, it supports customization of the frontend, with the ability to create custom screens, maps and dashboards.
- Efficiency: Zabbix is optimized for performance, with a low-overhead architecture and efficient data storage. It also supports data compression and data housekeeping to manage historical data.
- Integration: Zabbix supports integration with a variety of third-party tools, including Nagios, PRTG, and Grafana. It also supports integration with external scripts, like Python, Perl, or Shell. Additionally, it supports integration with cloud platforms such as Amazon AWS, Microsoft Azure, and Google Cloud.
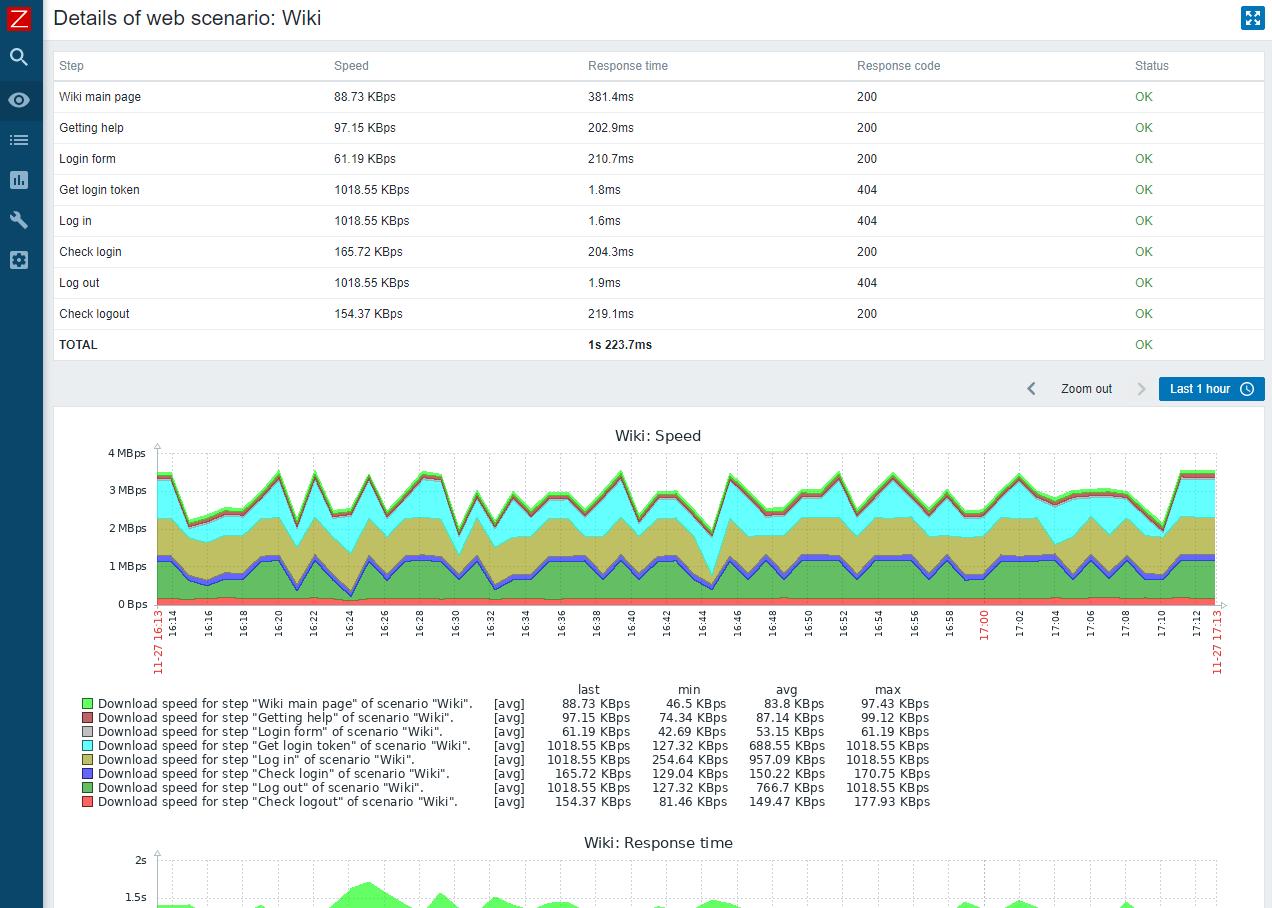
- Extensibility: Zabbix supports the use of custom plugins and scripts, allowing to extend its functionality. It also supports the use of custom alert scripts, allowing to define custom actions based on triggered alerts. Additionally, it supports the use of custom web-scenarios, allowing to define custom checks based on HTTP/HTTPS requests
- Machine Learning: Zabbix supports trend prediction, anomaly detection, baselining using statistical algorithms and machine learning techniques
Overall, Zabbix is a feature-rich monitoring platform that can be used to monitor a wide range of systems and environments. Its support for alerting, visualization, and automation make it a powerful tool for keeping your IT operations running smoothly.
Read more about Zabbix by reading reviews on top review platforms such as: G2, Capterra, TrustRadius.
Need a step-by-step guide for installing Zabbix? You can install it in as little as 10 minutes by following one of these tutorials: CentOS/RHEL, Ubuntu, Debian, Raspberry Pi OS (Rasbian)
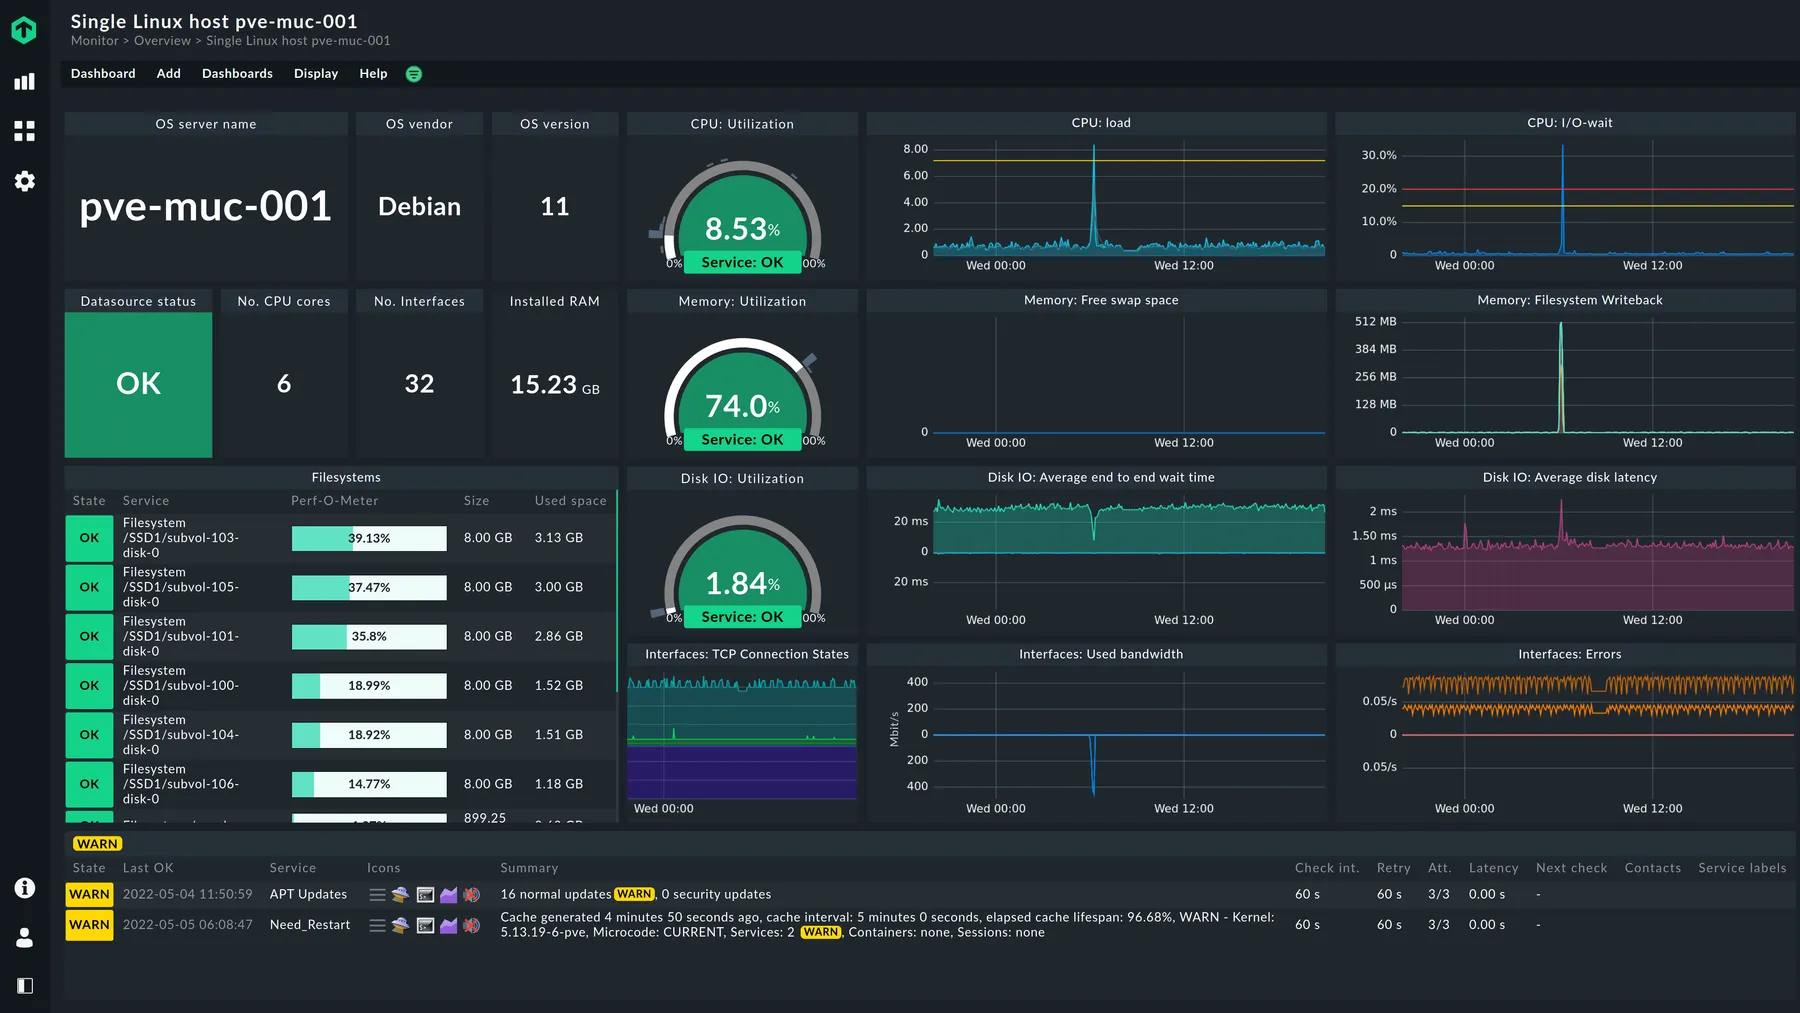
Overview of Checkmk
Checkmk, on the other hand, is a comprehensive monitoring platform that offers both open-source and enterprise editions. It provides an all-in-one solution for monitoring, alerting, and analytics, catering to the complex demands of modern IT environments. Checkmk stands out with its ability to monitor numerous devices, services, and applications through its efficient agent-based and agentless approaches.
Some of the key features of Checkmk include:
- Unified monitoring platform: Checkmk can monitor a wide range of systems, including Linux, Windows, Unix, VMware, Docker Containers and many more. It also supports a wide range of monitoring protocols, including SNMP, WMI, and SSH.
- Hybrid monitoring approach: Checkmk offers both agent-based and agentless monitoring. Agent-based monitoring uses lightweight software agents to collect metrics from the monitored devices. Agentless monitoring uses native operating system and application APIs to collect metrics.
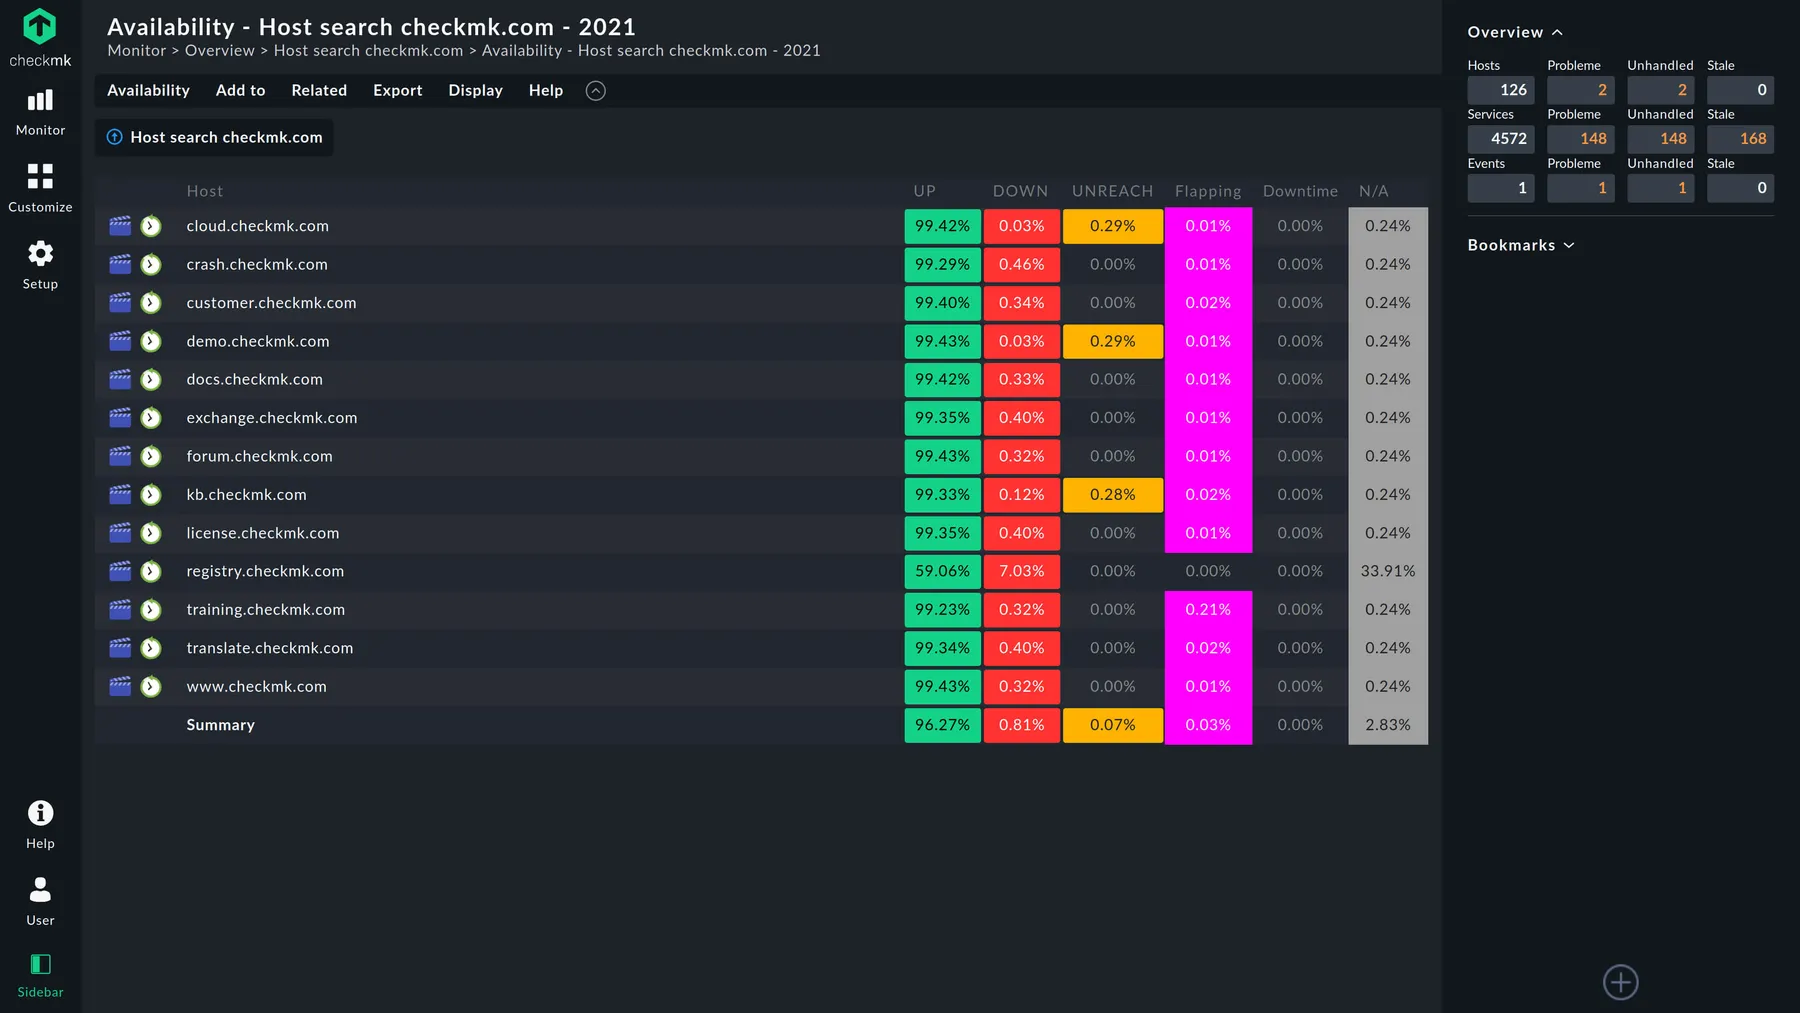
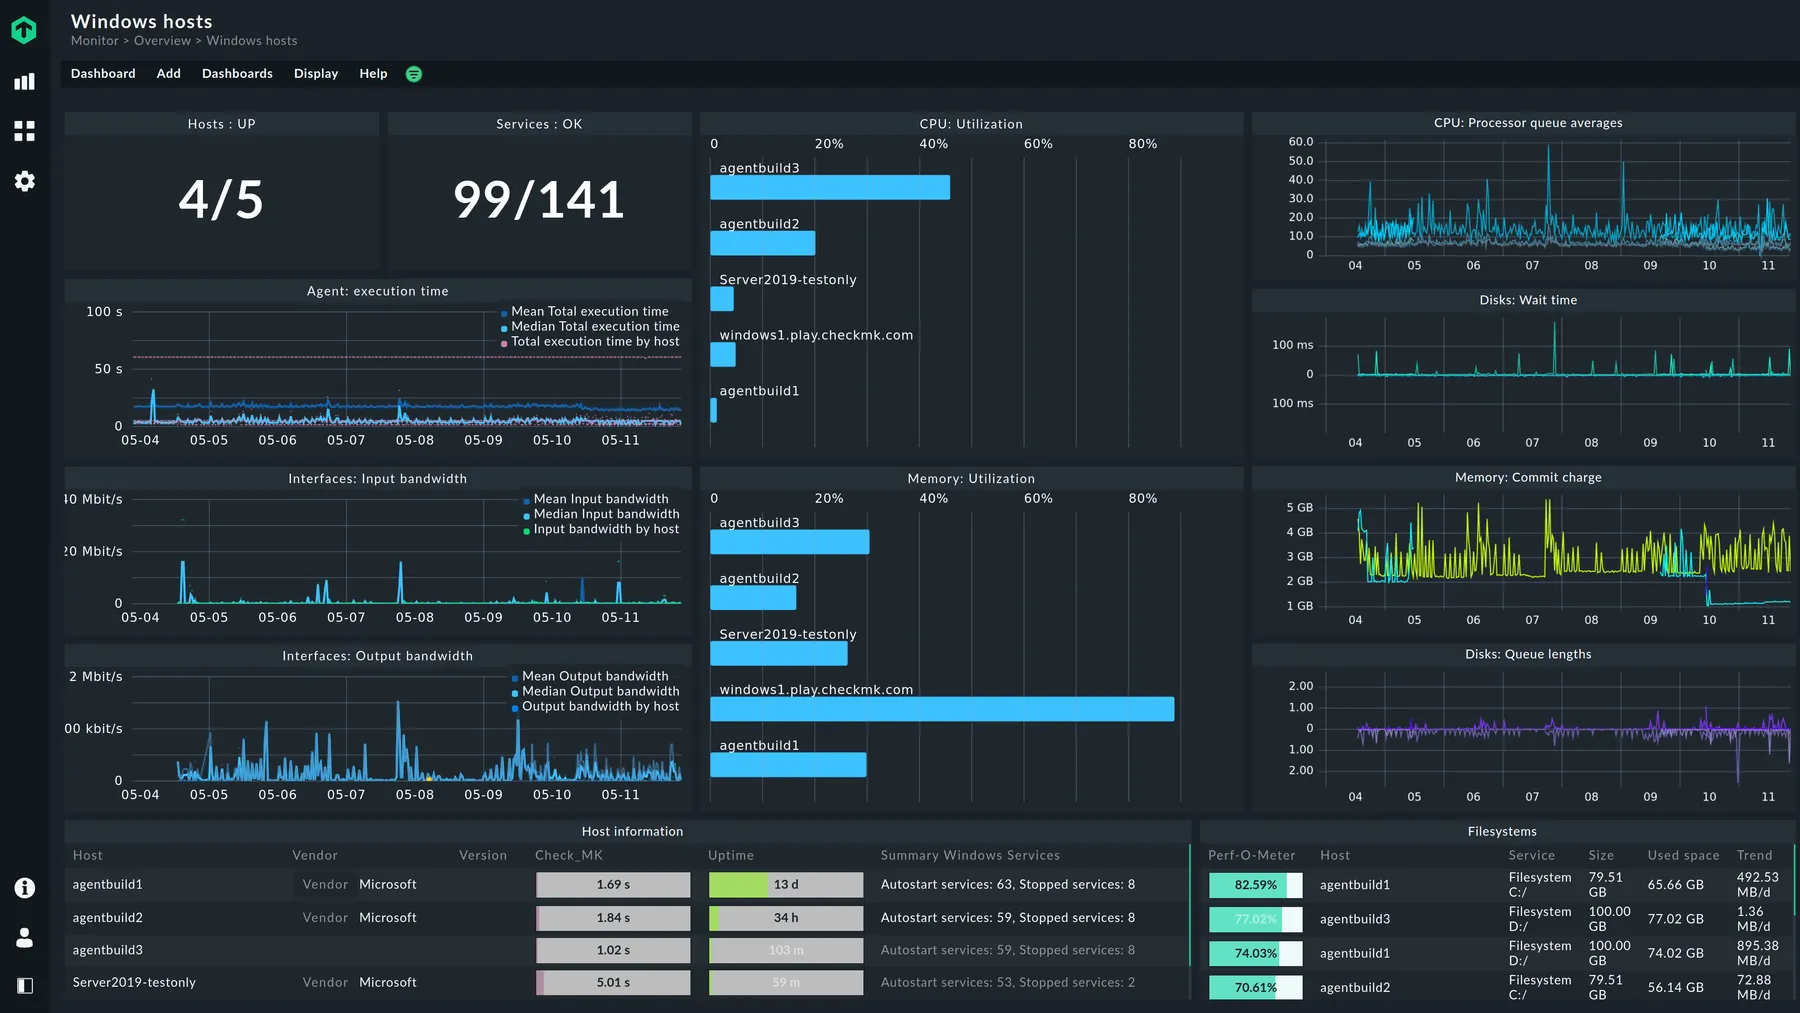
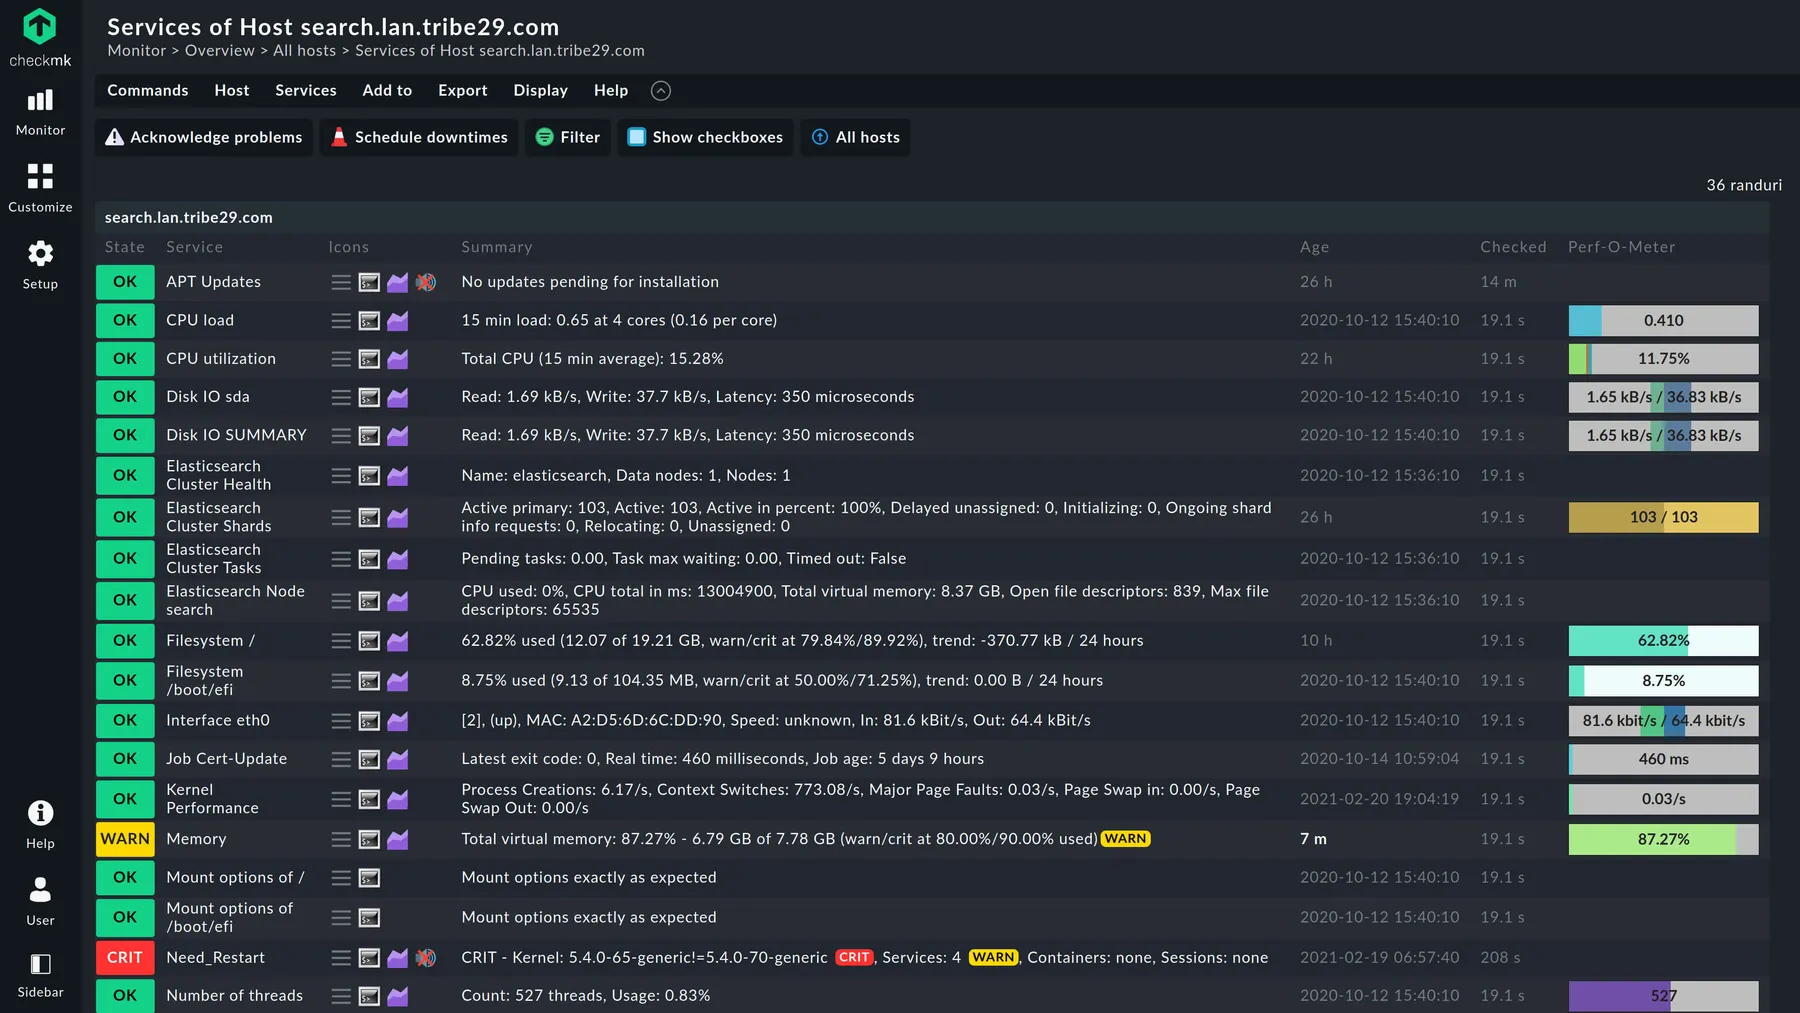
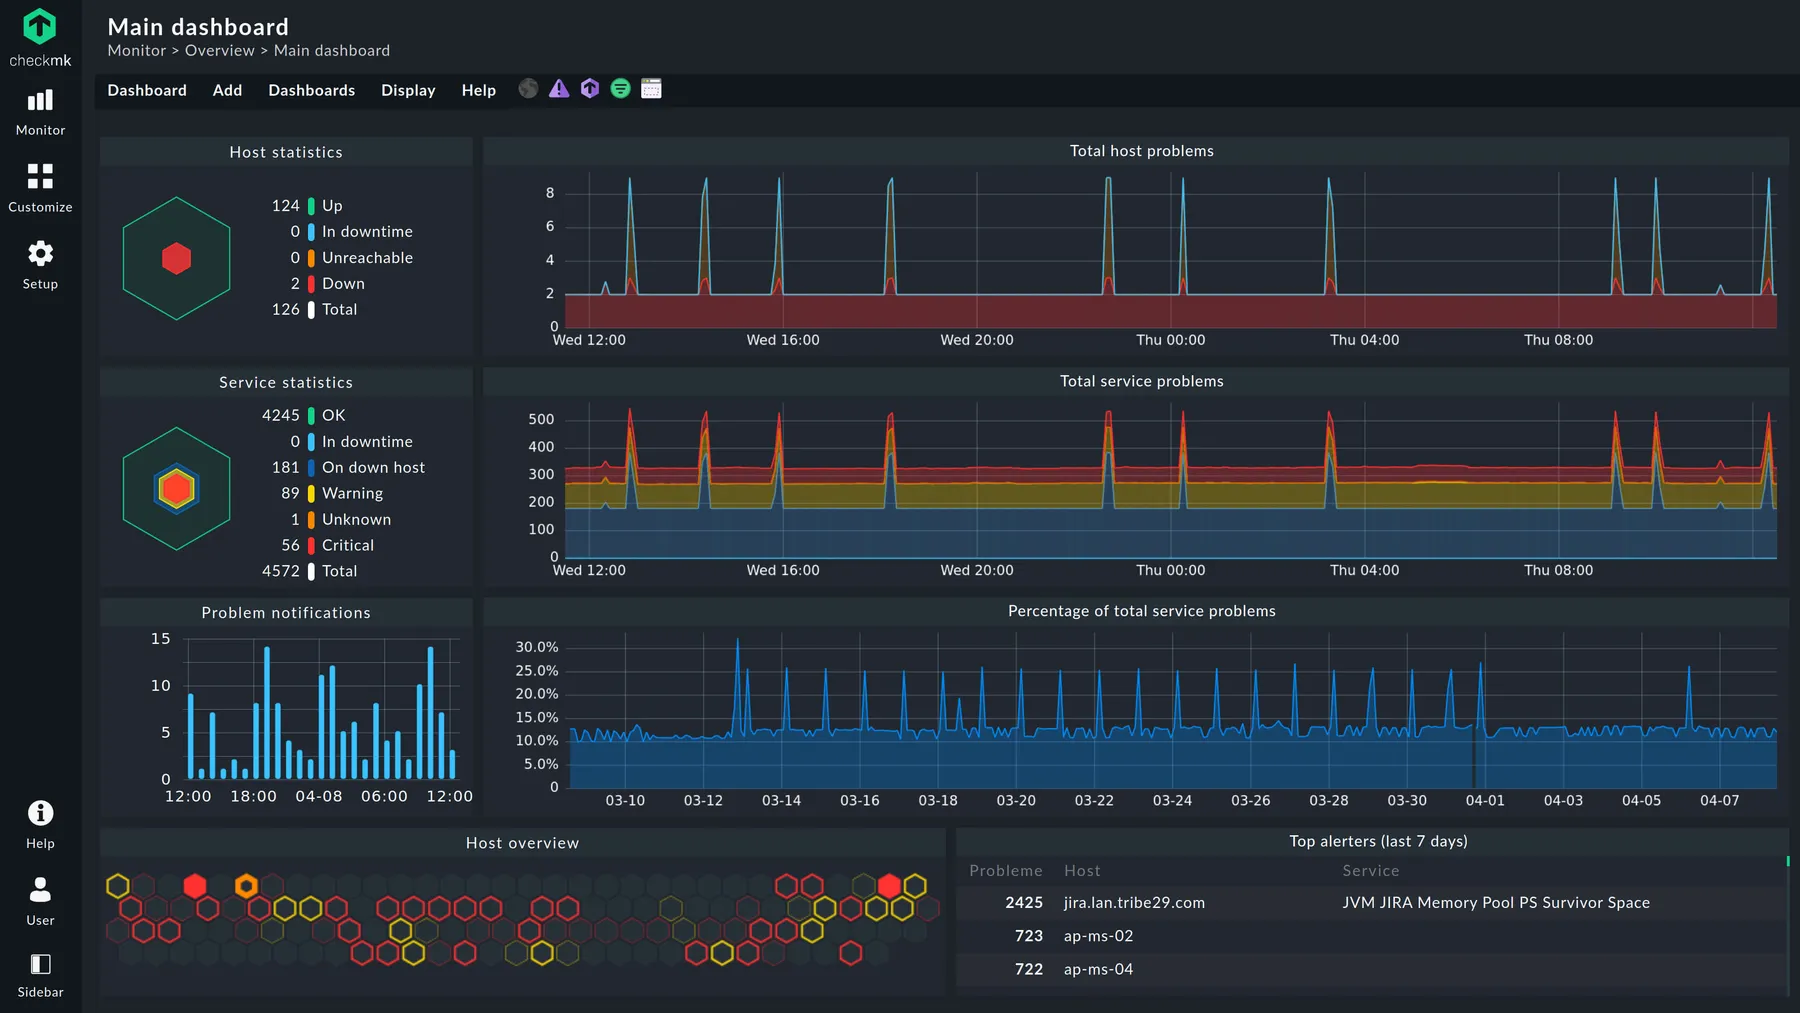
- Intuitive user interface: Checkmk’s user interface is easy to use and navigate. It provides a variety of dashboards and reports that can be customized to meet your specific needs.
- Auto-discovery and inventory management: Checkmk can automatically discover and add new devices to the monitoring system. It also maintains an inventory of all monitored devices, making it easy to track changes and ensure accurate monitoring coverage.
- Event handling and alerting: Checkmk can monitor metrics in real time and trigger alerts based on predefined thresholds or patterns. These alerts can be customized to your specific needs and can be delivered through various channels, such as email, SMS, or Slack.
- Business process monitoring: Checkmk can monitor complex business processes and workflows. This allows you to identify and troubleshoot performance issues that may impact your business.
- Open source and enterprise editions: Checkmk is available in both open source and enterprise editions. The open source edition is free to use and modify, while the enterprise edition offers additional features and support.
Read more about Checkmk by reading reviews on top review platforms such as: G2, Capterra, TrustRadius.
Key Differences between Zabbix and Checkmk
When comparing Zabbix and Checkmk, several key differences emerge:
- Scalability and Complexity: Zabbix excels in handling large-scale environments with its efficient data collection and great storage mechanisms. Checkmk, however, provides a more streamlined experience, making it ideal for organizations seeking simplified management and quick deployments.
- Ease of Use: Zabbix offers a user-friendly interface, but Checkmk’s interface and configuration processes are often regarded as more intuitive and beginner-friendly.
- Monitoring Approach: Zabbix primarily focuses on infrastructure monitoring, while Checkmk extends its capabilities to include application monitoring and business process monitoring.
Use Cases for Zabbix and Checkmk
The choice between Zabbix and Checkmk largely depends on your use case:
- Zabbix Use Cases: Zabbix is well-suited for organizations requiring extensive network monitoring and in-depth performance analysis. It is ideal for IT teams managing complex infrastructures that demand scalable monitoring capabilities. Zabbix is also a good choice for those who want a 100% software solution without any enterprise-paid modules.
- Checkmk Use Cases: Checkmk shines in environments that demand holistic monitoring, including infrastructure, applications, and services. However, it is important to note that out-of-the-box holistic monitoring with Checkmk will require the purchase of additional modules. These modules can be expensive, so organizations should carefully consider their needs before making a purchase.
Licensing and Pricing
Zabbix is open-source software, which means that it is 100% free to use and distribute. Furthermore, Zabbix SIA, the company behind Zabbix, provides paid services such as support, training, and custom development. These services are typically used by larger organizations that need more advanced monitoring capabilities or want to receive support from the Zabbix team.
Checkmk provides both open-source and enterprise editions. The open-source version delivers robust monitoring capabilities, while the enterprise edition adds advanced features and dedicated support.
Zabbix: Pros and Cons
Pros:
- Scalable architecture for large environments.
- Customizable alerting and notification options.
- Hybrid agent-based and agentless monitoring approach.
- Extensive library of preconfigured templates.
- Active user community contributing to plugins and enhancements.
Cons:
- Steeper learning curve for complex setups.
- Dashboard customization can be complicated.
Checkmk: Pros and Cons
Pros:
- Intuitive interface with easy configuration.
- Comprehensive monitoring of infrastructure and applications.
- Hybrid agent-based and agentless monitoring approach.
- Regular updates and enterprise support in the paid version.
Cons:
- Might be overkill for smaller environments.
- Certain advanced features are limited to the enterprise edition.
- Limited template library compared to Zabbix.
Customer testimonials
Switched from Zabbix to CheckMK to reduce admin effort.
Zabbix is really great but needs some attention regarding updates, database etc. The Zabbix item prototypes are simply awesome when you know how to create them and work with them. I invested quite some time to get all my devices monitored the way I wanted to.
CheckMK is as easy as it gets. Installing / upgrading is dead simple. Monitors my whole infrastructure out of the box. Adding news devices happens automatically and just works.
Only thing that is really a PITA: If you want to monitor your server volumes, you must install the CheckMK agent. Zabbix gets VM disk info directly via the VMWare monitoring. CheckMK doesn’t.
So with Zabbix I had a handful of agents installed on my servers to get more detailed infos like running services etc. With CheckMK I have an agent running on all machines.
On the other hand, CheckMK Agent updates automatically on all machines and this works 99% of the time.
Performance wise I have to say that zabbix and checkmk are on par. But as I said, CheckMK needs way less effort so set up and maintain.
KnownTumbleweed from reddit post
I implemented Zabbix at a company with 40+ servers without any knowledge of Linux or Zabbix. Took me about 2-3 weeks to setup and monitor servers, printers, switches, Access points etc.
Zabbix is powerful and can be complicated, but it can also be very simple if what you want to monitor is simple. Is xx down? Printer running out of ink? Pretty simple to setup when you understand the basics.
Later i implemented a setup in Zabbix, which automaticly added monitoring on all new access points added to the network, now that was a tough job, but helped me understanding how powerful Zabbix is and now we’re automating much more
nicolaj1994 from reddit post
My preference is Checkmk
While up front it can be easy, it can go really really really deep if you want to.
Handles push, pull, agent, agentless, snmp (all), custom, etc. Can do forecasting, reports, dashboards, but really, you don’t have to even do all of that. Handles events, syslogs, snmptraps. Lots of notification options. Allows end users to get notified for “whatever” they choose if they want. Has flap detection. Ability to set scheduled downtimes for hosts as well as individual services. Can monitor clustered services. You can also create business logic rules for disparate services (e.g. “thing” is up if this and this and at least one of this is up, etc..).
I haven’t found anything I could not do with Checkmk.
At work we’re monitoring about 10,000 services across 170 hosts and that’s not including all Windows log events, snmptraps, syslogs, etc.
cjcox4 from reddit post
Zabbix is pretty good. And FLOSS. I don’t love the Web UI – I came from Zenoss when it drifted closed source. I preferred some things about Zenoss, but we have made Zabbix work. It’s real simple to get ping monitoring going, and the agent makes Windows / Linux / whatever monitoring easy. There are also templates out there in the community for all sorts of stuff like I think ubiquiti edgeswitches etc that add more.
I think it’s the best one for free right now, but there are certainly things I’d like to be different about it in the UI.
jmp242 from reddit post
Conclusion
Zabbix and Checkmk are both powerful monitoring solutions with a wide range of features. The best choice for you will depend on your specific needs and requirements.
Zabbix is a good choice for organizations with complex infrastructures and the desire for extensive customization. It is scalable, flexible, and efficient, and it has a large library of preconfigured templates. However, it can have a steep learning curve and dashboard customization can be complex.
Checkmk is a good choice for organizations that want an easy-to-use monitoring solution with comprehensive monitoring capabilities. It has a user-friendly interface. However, it might be overkill for smaller environments and certain advanced features are limited to the enterprise edition.
I don’t think that you can go wrong with one or the other!
Ultimately, the best way to decide which monitoring solution is right for you is to try both Zabbix and Checkmk and see which one you prefer.