I have been working with Zabbix since 2011, and I am still waiting for it to become as user-friendly and simple as PRTG. In my opinion, PRTG is the simplest monitoring tool that has managed to maintain its simplicity despite having tons of features, although it does come with a hefty price tag!
The main reason I started using PRTG was that the college, where I was running the lab practice for the students, did not have Linux available. PRTG was one of the few monitoring tools that supported Windows. I was surprised at how quickly and easily it was to set up PRTG for the local network.
| Name | Links | Licence | Visits / Month | Reviews |
| Zabbix | Wiki, Twitter, Youtube | Free | 750 000 | G2, Capterra, TrustRadius |
| PRTG | Wiki, Twitter, Youtube | Commercial / Limited Free | 700 000 | G2, Capterra, TrustRadius |
You may be wondering why I’m using Zabbix if PRTG is so easy to use and has a lot of features. Well, just like everything, PRTG and Zabbix are not perfect. They both have their pros and cons, and both of them have a place in the monitoring world. It all depends on your priorities and requirements for monitoring.
Continue reading to find out more about Zabbix and PRTG and which one is right for you!
Table of Contents
Overview of Zabbix
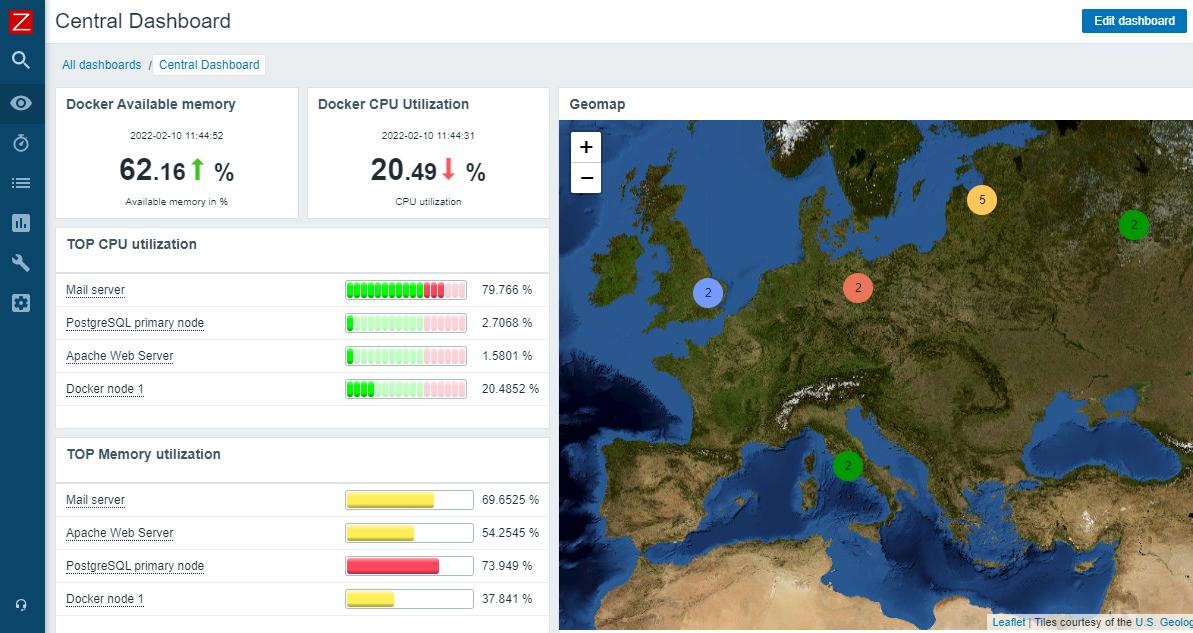
Zabbix has emerged as a robust, open-source monitoring solution trusted by organizations worldwide. Its comprehensive suite of features includes real-time monitoring, alerting, visualization, and capacity planning. With a client-server architecture, Zabbix collects data from various monitored devices and provides insightful metrics through its user-friendly web interface. Zabbix’s flexibility, coupled with a vast library of prebuilt templates, makes it an attractive option for businesses seeking a versatile monitoring tool.
Some of the key features of Zabbix include:
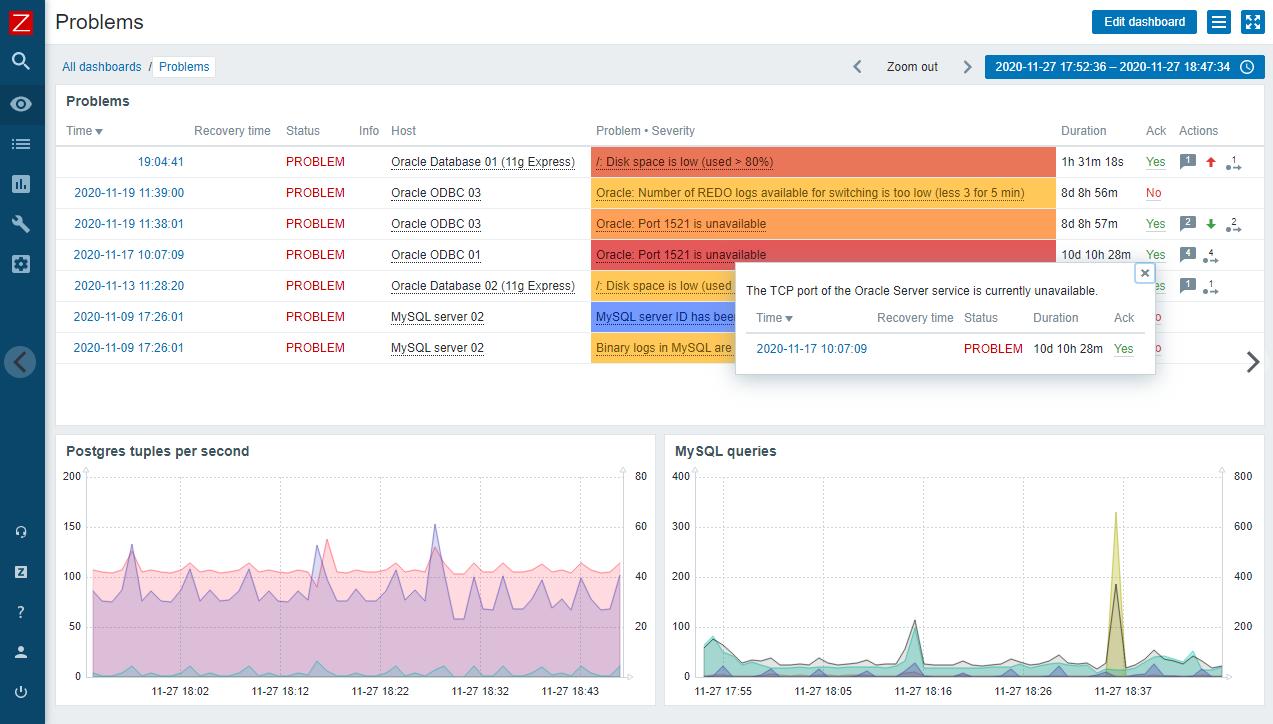
- Alerting: Zabbix has a comprehensive alerting system that can send notifications via email, SMS, or other channels when issues arise. It also supports event correlation, which allows to analyze and filter multiple events, reducing the number of false alarms. Additionally, it has a flexible alerting mechanism that allows to define multiple media types (email, sms, Jabber, etc) and alert scripts.
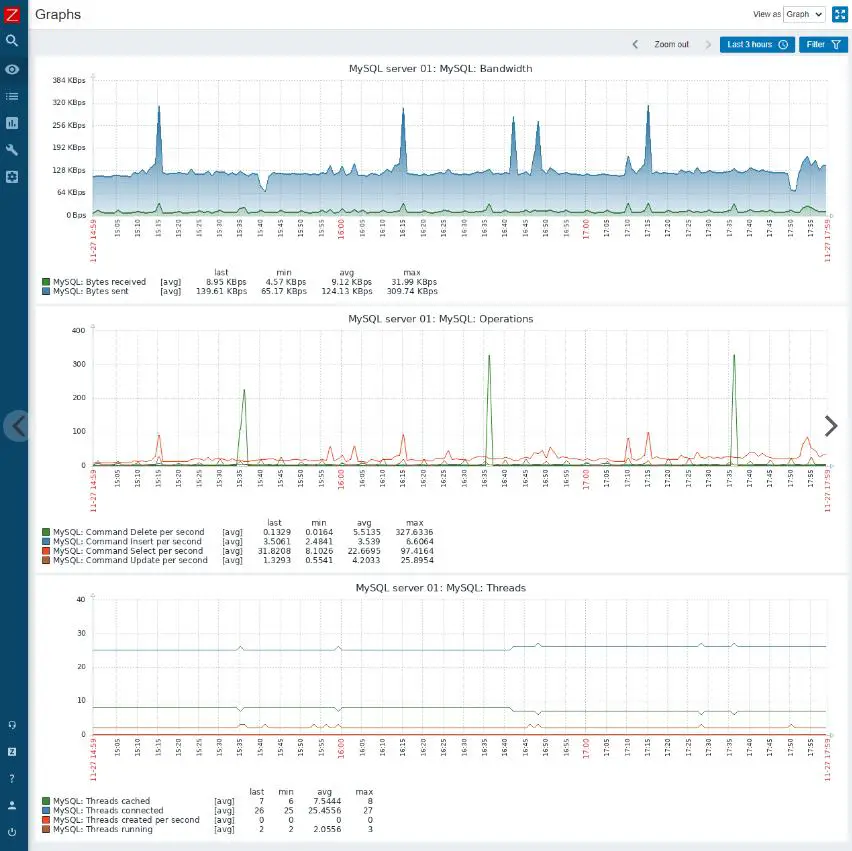
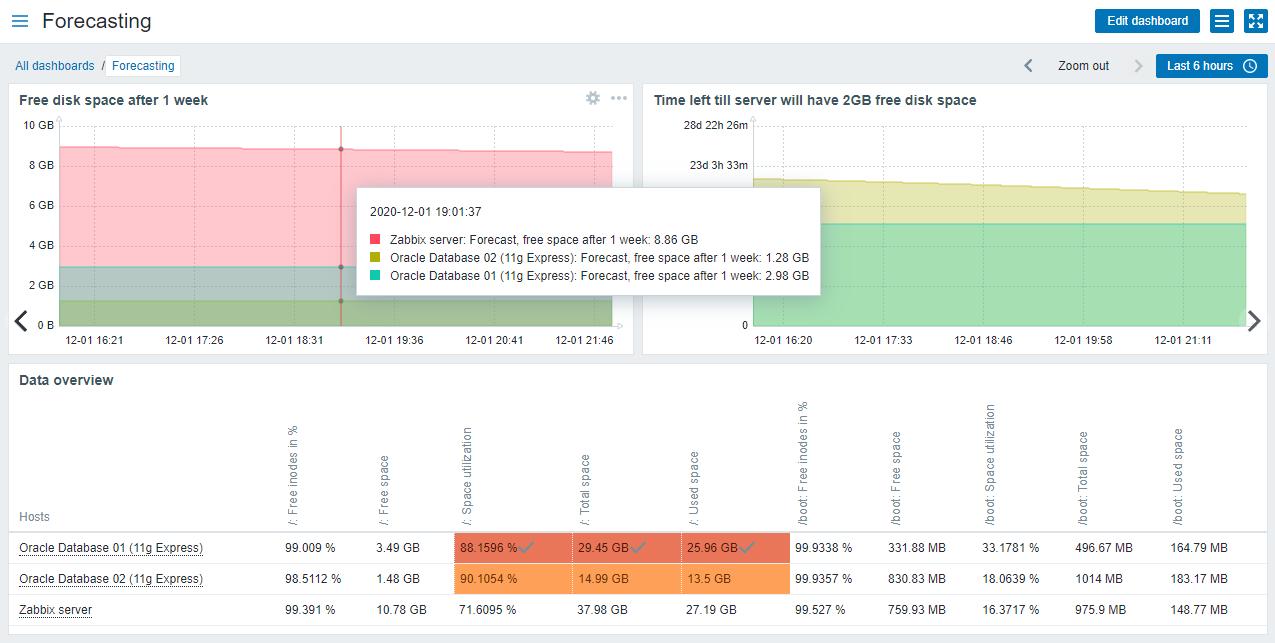
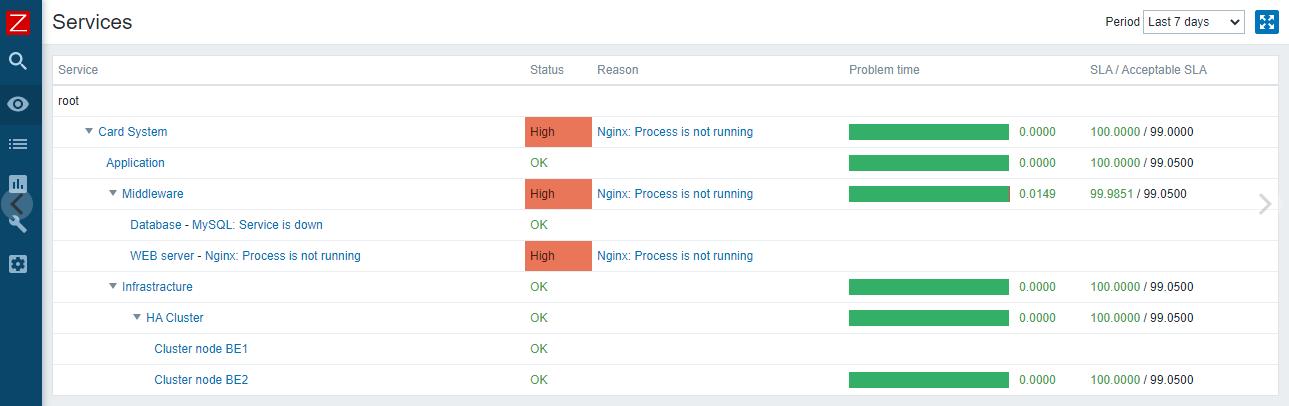
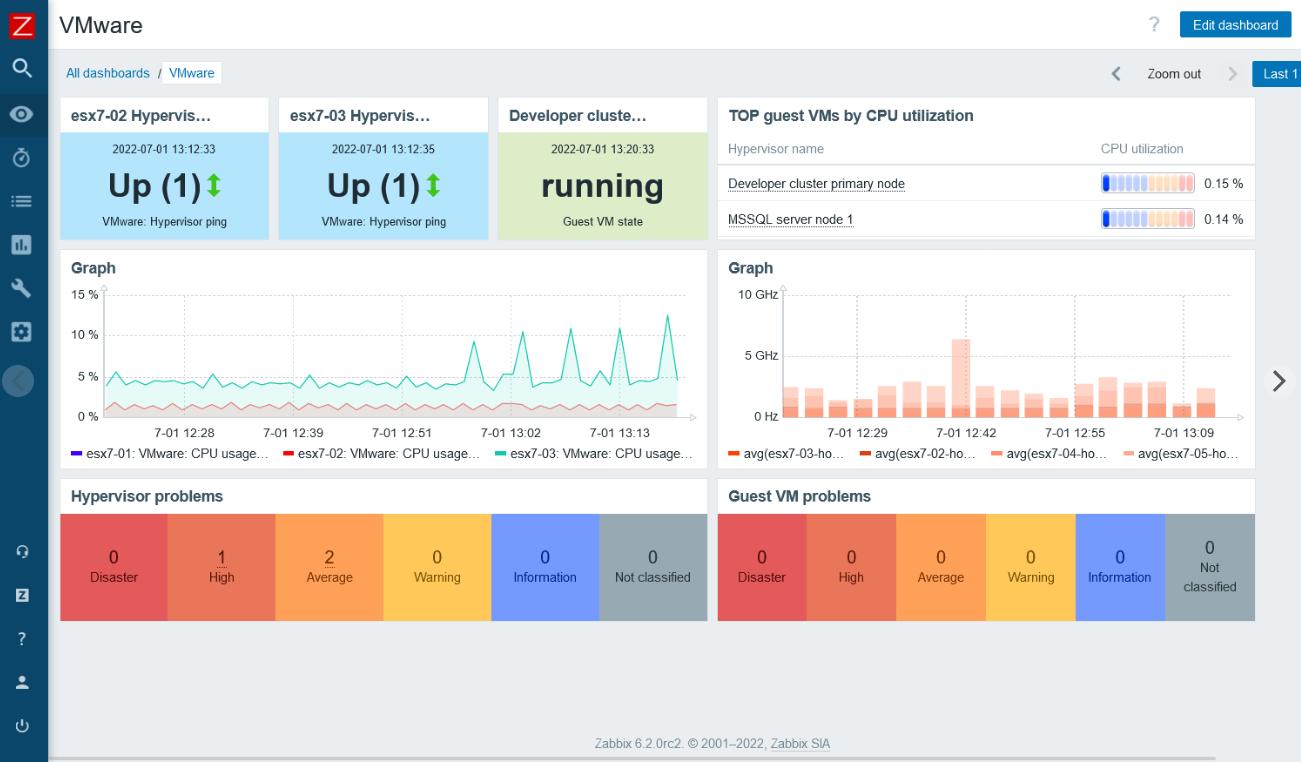
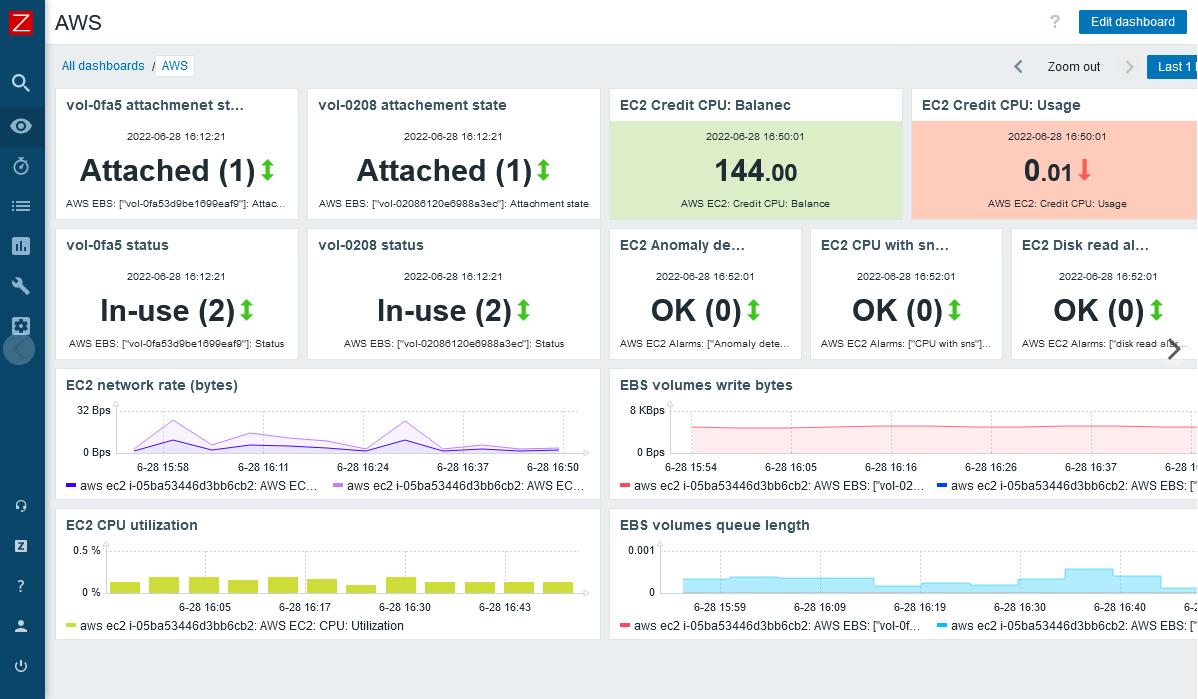
- Visualization: Zabbix provides a variety of options for visualizing data, including graphs, maps, and dashboards. It also has a built-in reporting engine for creating custom reports. Additionally, it supports export and import of data in different formats.. It also supports real-time monitoring, with a web-based dashboard that can be accessed from any device.
- Automation: Zabbix supports automation through the use of scripts and integrations with other tools. This makes it easy to automate tasks such as deploying new servers or scaling infrastructure. It also supports web-hooks which allows to trigger external actions. It also has an API that allows to automate tasks such as creating hosts, items, triggers, etc. Additionally, it supports discovery of network devices and services, automatically creating and updating monitoring items.
- Scalability: Zabbix can handle a large number of hosts and metrics, with a distributed architecture that allows to scale horizontally. It also supports high availability, with active-passive cluster and distributed monitoring.
- Flexibility: Zabbix supports a wide range of operating systems and platforms, including Windows, Linux, MacOS, and more. It also supports a variety of agents such as Zabbix agent, SNMP, JMX, IPMI, etc. Additionally, it supports customization of the frontend, with the ability to create custom screens, maps and dashboards.
- Efficiency: Zabbix is optimized for performance, with a low-overhead architecture and efficient data storage. It also supports data compression and data housekeeping to manage historical data.
- Integration: Zabbix supports integration with a variety of third-party tools, including Nagios, PRTG, and Grafana. It also supports integration with external scripts, like Python, Golang, or Shell. Additionally, it supports integration with cloud platforms such as Amazon AWS, Microsoft Azure, and Google Cloud.
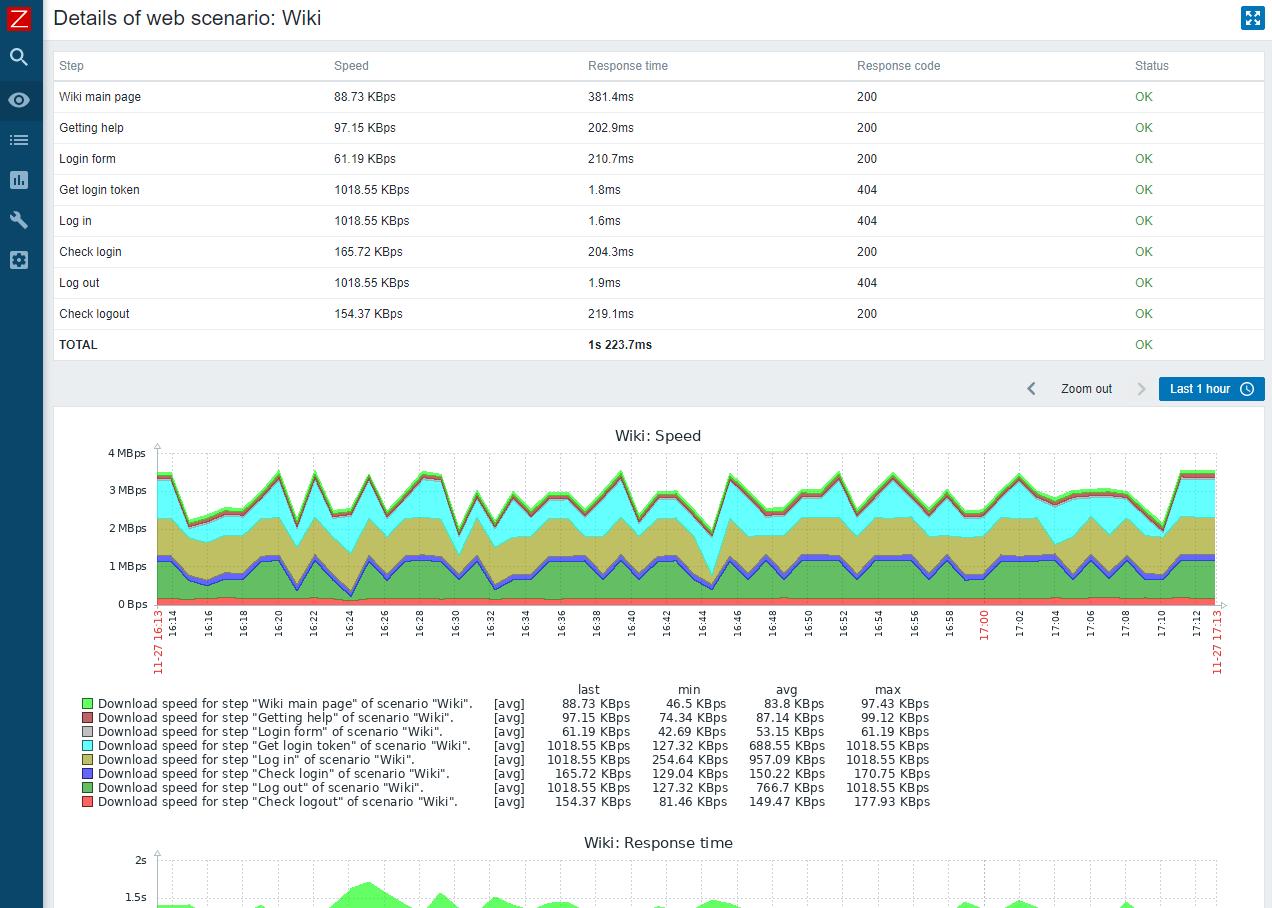
- Extensibility: Zabbix supports the use of custom plugins and scripts, allowing to extend its functionality. It also supports the use of custom alert scripts, allowing to define custom actions based on triggered alerts. Additionally, it supports the use of custom web-scenarios, allowing to define custom checks based on HTTP/HTTPS requests
- AI: Zabbix supports trend prediction, anomaly detection, baselining using statistical algorithms and AI techniques.
Overall, Zabbix is a feature-rich monitoring platform that can be used to monitor a wide range of systems and environments. Its support for alerting, visualization, and automation make it a powerful tool for keeping your IT operations running smoothly.
Read more about Zabbix by reading reviews on top review platforms such as: G2, Capterra, TrustRadius
Overview of PRTG
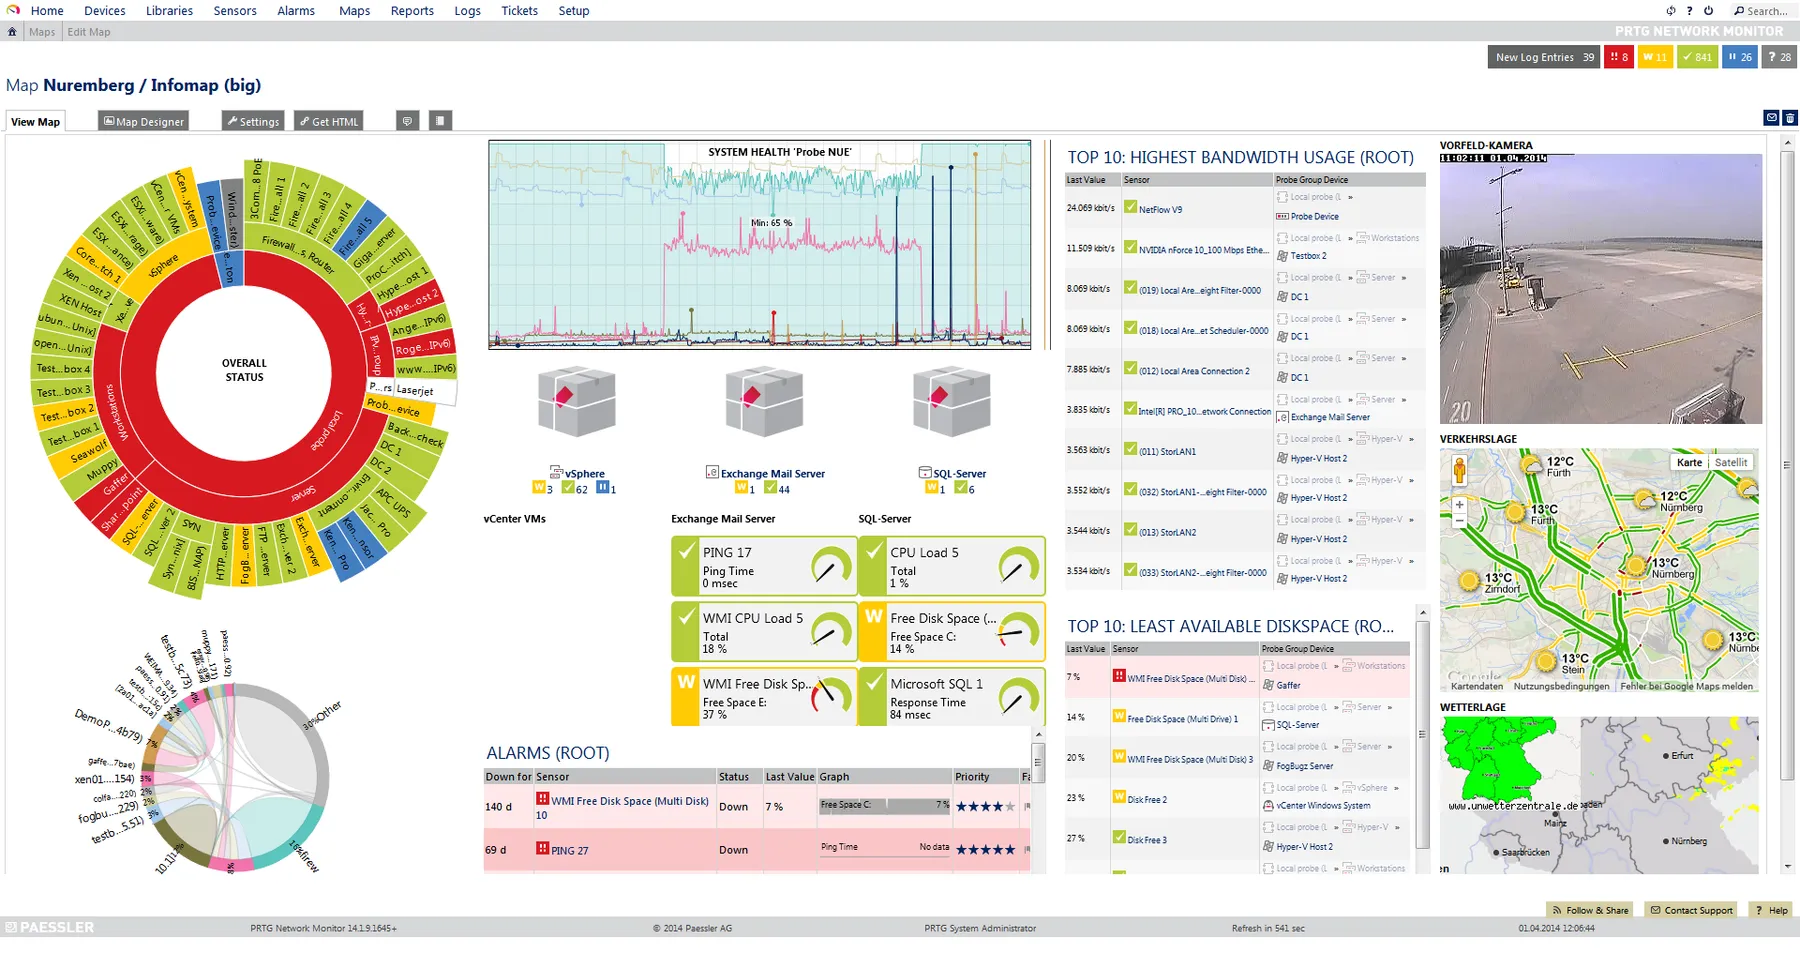
PRTG, short for Paessler Router Traffic Grapher, is a comprehensive network monitoring solution designed to provide real-time insights into your IT infrastructure. With its user-friendly interface and robust capabilities, PRTG offers a range of features that cater to various monitoring needs. Whether you’re a small business or an enterprise, PRTG offers valuable tools to ensure the health and performance of your network.
Key Features:
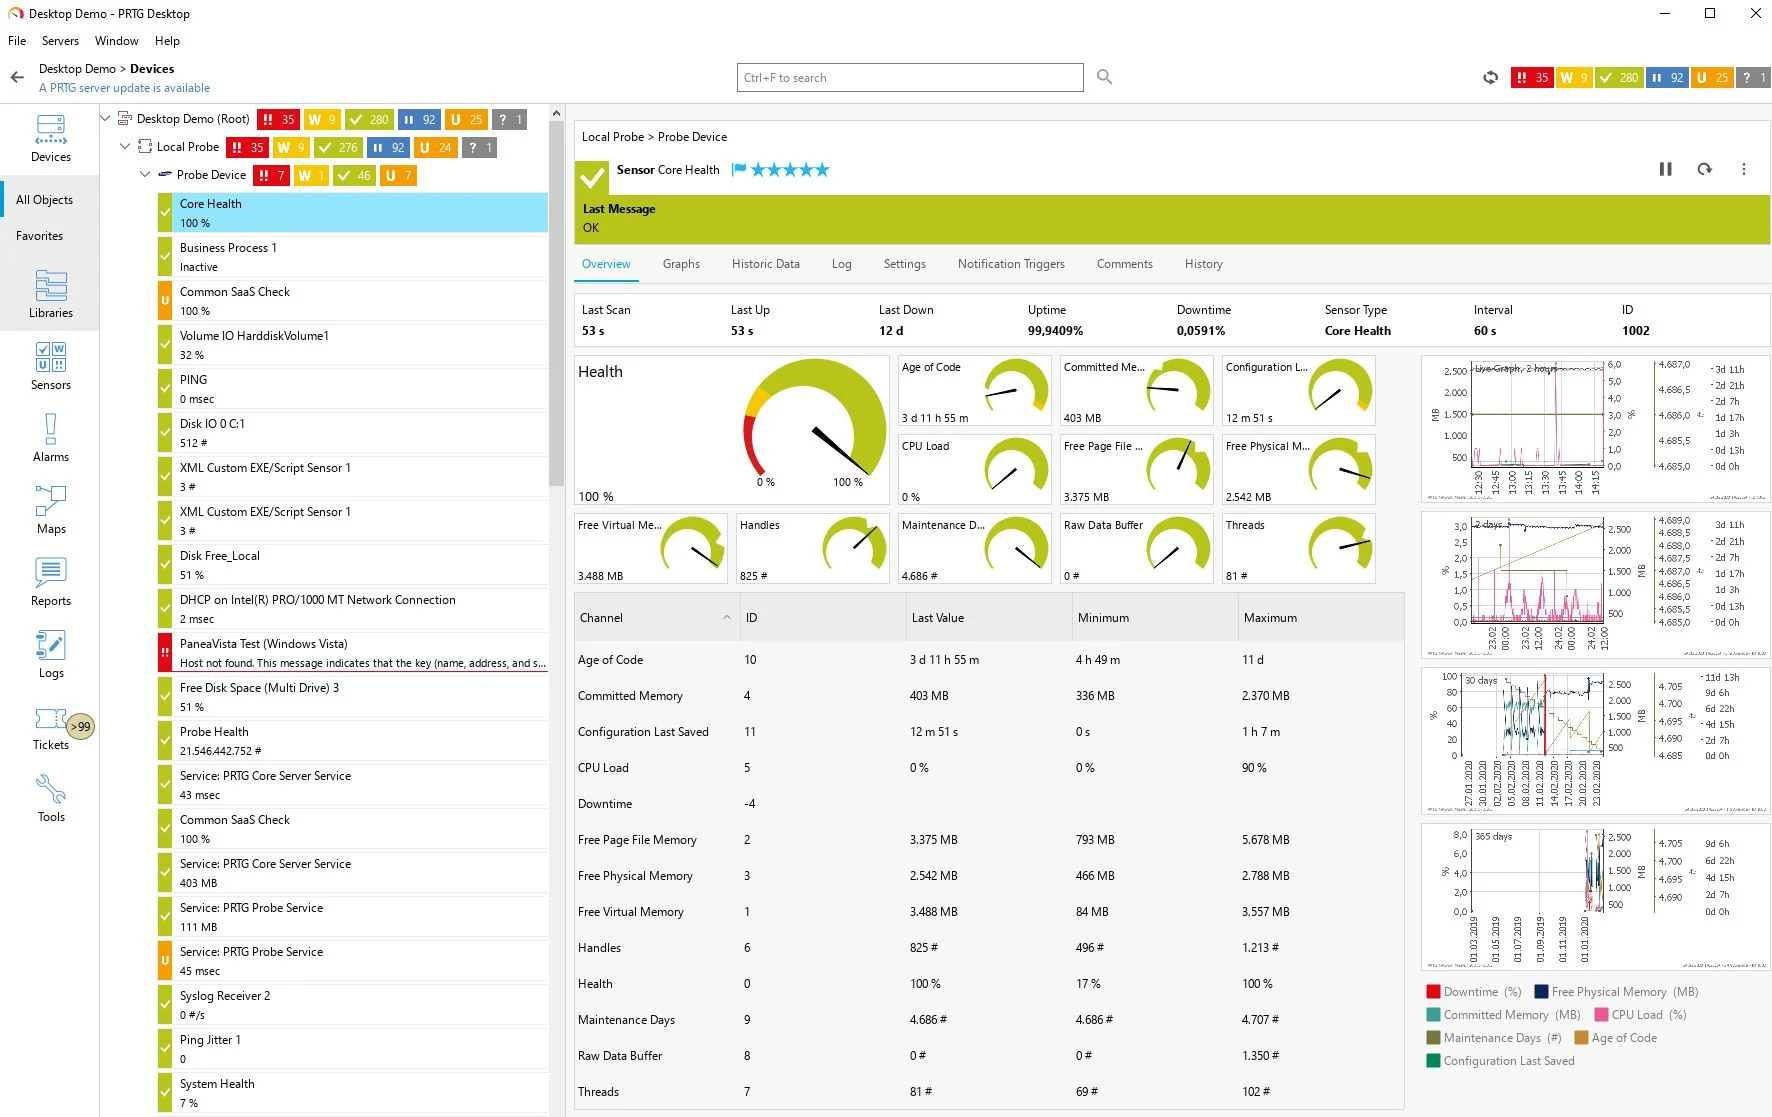
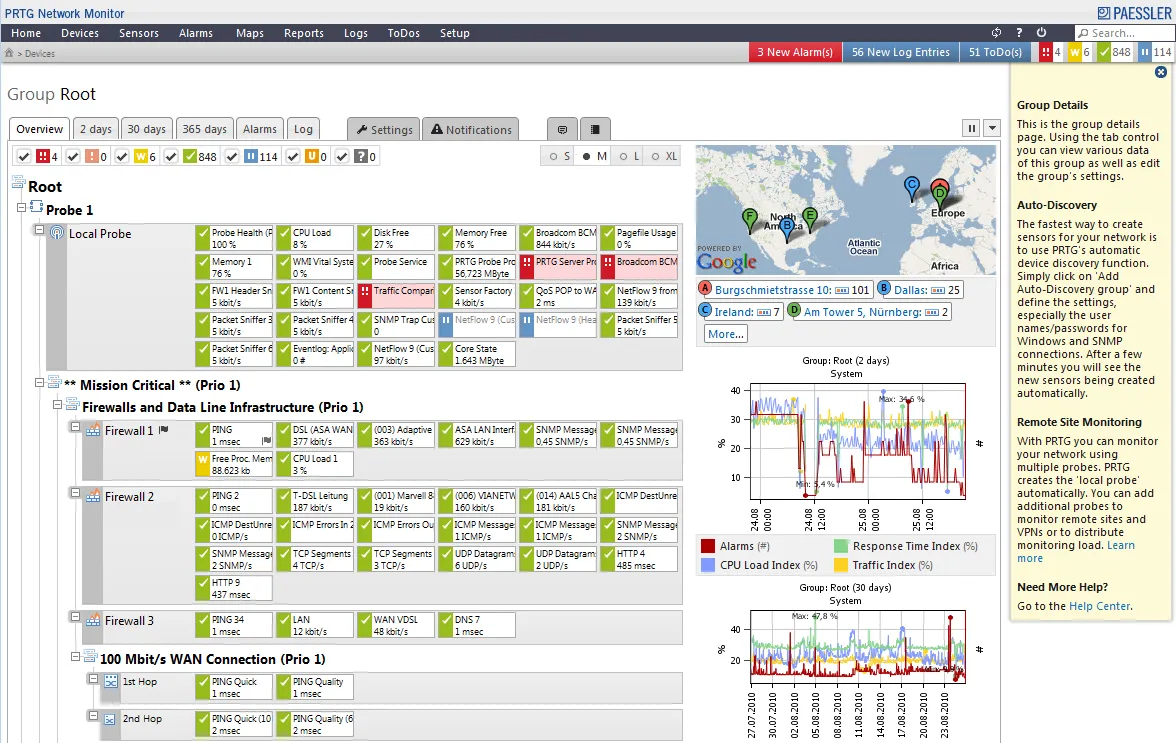
- Sensor-Based Monitoring: PRTG operates on a sensor-based approach, allowing you to monitor various aspects of your network using predefined or custom sensors.
- Quick Setup: The intuitive web interface and guided setup process make getting started with PRTG a breeze, even for those new to network monitoring.
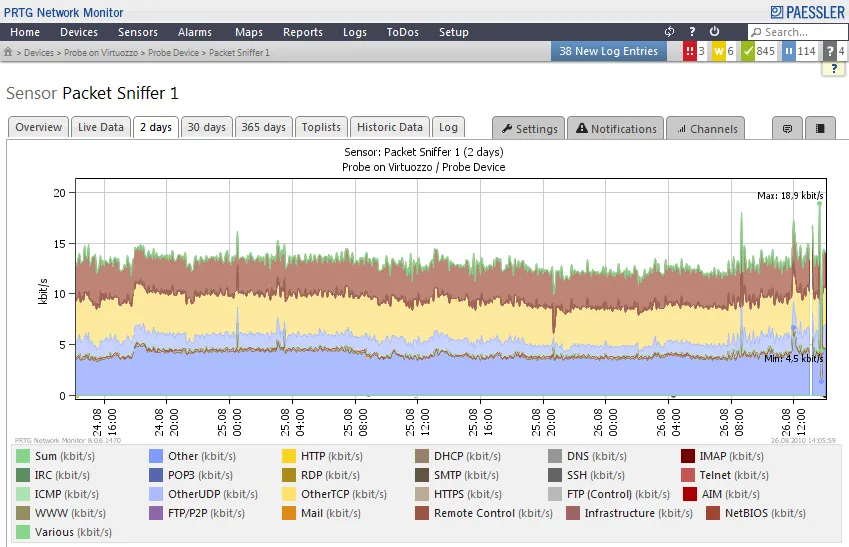
- Wide Range of Sensors: PRTG supports a diverse set of sensors including SNMP, WMI, NetFlow, HTTP, and more, ensuring flexibility in monitoring different devices and metrics.
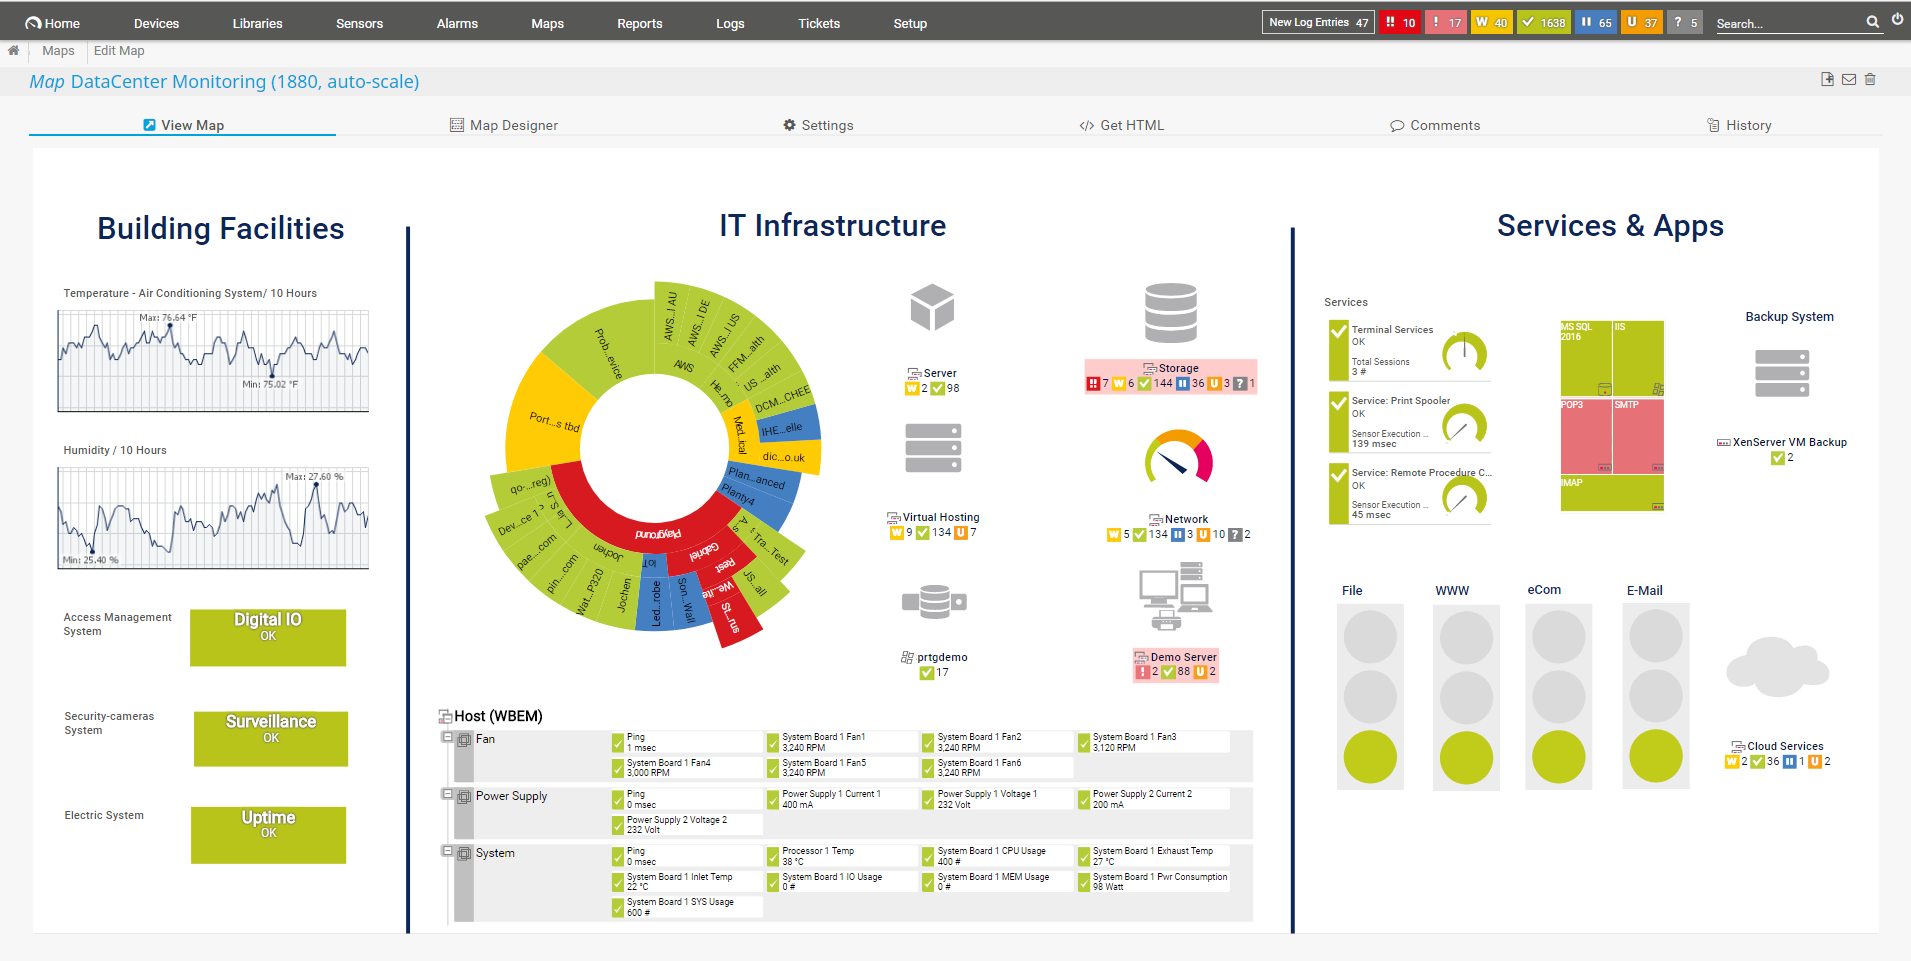
- Customizable Dashboards: Create personalized dashboards to visualize real-time data, helping you quickly identify trends, issues, and performance bottlenecks.
- Alerting and Notifications: Set up customizable alerts based on thresholds you define. Receive notifications via email, SMS, or other channels, ensuring prompt action in case of anomalies.
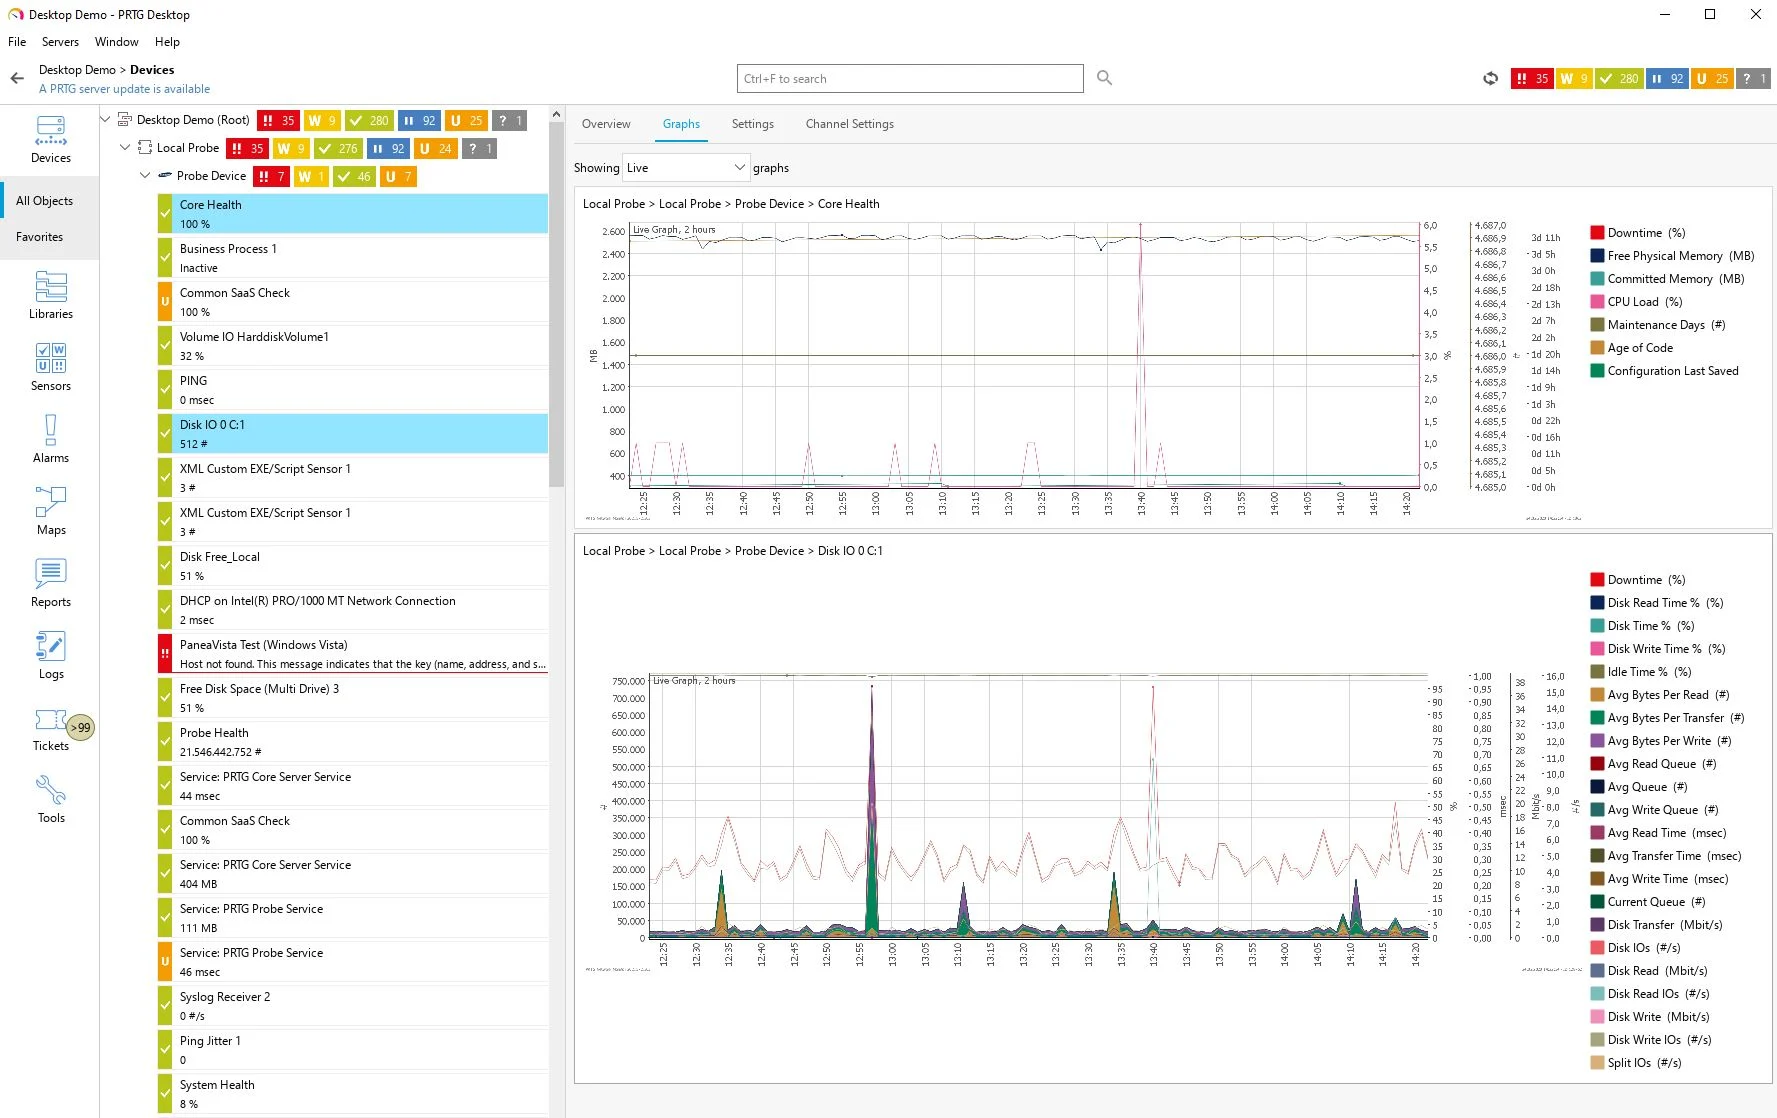
- Historical Data Analysis: PRTG stores historical data, allowing you to analyze trends, identify patterns, and make informed decisions to optimize your network’s performance.
- Maps and Visualization: Create network maps that visually represent your infrastructure. This helps in understanding dependencies and relationships among devices.
- Remote Monitoring: Monitor distributed networks and remote locations efficiently, enabling centralized control and management of your entire network.
- Cloud Monitoring: PRTG supports cloud monitoring, allowing you to monitor resources and services hosted in cloud environments such as AWS, Azure, and more.
- Reports and Analysis: Generate detailed reports on various aspects of your network’s performance, helping you communicate insights to stakeholders effectively.
- Scalability: PRTG offers different licensing tiers based on the number of sensors required, ensuring scalability as your network grows.
In summary, PRTG combines simplicity with powerful monitoring capabilities, making it a versatile tool for businesses of all sizes. Its sensor-based approach, customizable features, and ease of use make it an attractive option for IT professionals seeking reliable network insights.
Read more about PRTG by reading reviews on top review platforms such as: G2, Capterra, TrustRadius
Key Differences between Zabbix and PRTG
- Open Source vs Commercial: One of the fundamental differences is their licensing models. Zabbix is open-source and available for free, while PRTG follows a commercial licensing model with a free version that has limitations on the number of monitored sensors.
- Flexibility and Customization: Zabbix provides more flexibility in terms of customization and fine-tuning of monitoring parameters, making it suitable for complex and specific monitoring needs. PRTG, while user-friendly, may have some limitations in highly customized monitoring scenarios.
- Ease of Use: PRTG is often praised for its user-friendly interface and ease of setup. It is considered more accessible for users without extensive technical backgrounds. Zabbix, while powerful, might have a steeper learning curve due to its advanced features and configuration options.
- Scalability: Zabbix is known for its scalability and can handle a large number of monitored devices and metrics. PRTG also supports scalability but might require more careful planning as the number of sensors increases.
Use Cases for Zabbix and PRTG
- Zabbix: Due to its robust feature set, Zabbix is well-suited for medium to large enterprises that require in-depth monitoring and control over various aspects of their IT infrastructure. It’s also ideal for environments where custom monitoring and extensive configuration are necessary.
- PRTG: PRTG is a great fit for smaller to medium-sized businesses that prioritize ease of use and quick deployment. It’s suitable for IT teams that want a comprehensive overview of their network health without delving into complex configuration.
Licensing and Pricing
Zabbix is open-source and 100% free to use. There are no licensing costs, but users might need to allocate resources for deployment, maintenance, and support.
PRTG offers a free version with up to a limited number of sensors. Beyond that, PRTG’s commercial licenses are priced based on the number of sensors required for monitoring. The cost can increase as the monitoring scope expands.
| Plan | Price (per server license) | Description |
|---|---|---|
| PRTG 500 | €1,449 | Monitor up to 500 device aspects (about 50 devices) |
| PRTG 1000 | €2,649 | Monitor up to 1000 device aspects (about 100 devices) |
| PRTG 2500 | €5,599 | Monitor up to 2500 device aspects (about 250 devices) |
| PRTG 5000 | €9,999 | Monitor up to 5000 device aspects (about 500 devices) |
| PRTG XL | €13,799 | Monitor up to 10000 device aspects (about 1000 devices) |
Zabbix: Pros and Cons
Pros:
- Comprehensive monitoring capabilities.
- Highly customizable for specific needs.
- Strong community support and open-source nature.
- Scalable to handle large environments.
Cons:
- Complex setup and configuration for newcomers.
- Steeper learning curve.
- Requires more effort for initial deployment and ongoing maintenance.
PRTG: Pros and Cons
- Intuitive and user-friendly interface.
- Quick and easy deployment.
- Well-suited for users with limited technical expertise.
- Provides a good balance between features and usability.
- Supports network monitoring with Netflow protocol
- Supports all operating systems (Windows, Linux, Unix)
Cons:
- Free version is limited by the number of sensors.
- Might not offer the same depth of customization as Zabbix.
- Could face scalability challenges in extremely large environments.
- Licenses can become very expensive in a large environment.
Customer testimonials
I implemented Zabbix at a company with 40+ servers without any knowledge of Linux or Zabbix. Took me about 2-3 weeks to setup and monitor servers, printers, switches, Access points etc. Zabbix is powerful and can be complicated, but it can also be very simple if what you want to monitor is simple. Is xx down? Printer running out of ink? Pretty simple to setup when you understand the basics. Later i implemented a setup in Zabbix, which automaticly added monitoring on all new access points added to the network, now that was a tough job, but helped me understanding how powerful Zabbix is and now we’re automating much more
nicolaj1994 from reddit post
Zabbix has a little bit of a learning curve. Something like PRTG is much easier to setup. But PRTG licensing is very limiting, you gotta think about how you want to spend your “sensors”. With Zabbix, once I wrote a script to install and configure the agent, it was easy. Once I had everything setup, just the default agent templates have so much monitoring, it’s nuts. I think whatever little time I had to spend learning Zabbix, (on the clock) was worth it for my employer, because if I were to setup the same level of monitoring, it would have cost them tens of thousands in PRTG licensing. And because I could just monitor everything without worrying about licensing, I was monitoring stuff I wouldn’t have planned on, and had it catch things before it became a problem.
zrad603 from reddit post
PRTG syslog and netflow are not really what it is suited for. You can put the data in there but getting actionable information out is difficult. It really is designed as a monitoring/health management tool and not a comprehensive ELK tool.
thortgot from reddit post
PRTG any numbers it can collect that it knows how to set up and collect, it’s da bomb, anything that it’s bread and butter, it’s amazing. Out of the box, this includes switchport stats, wmi, ipmi, service monitoring, tls monitoring, uptime monitoring, system health, even email gateways, etc… Anything that can be monitored visa SMTP, it’s da bomb. You may have to to do some OID lookups yourself and copy paste some OID fields, but then you’ve your monitoring the amperages on all the banks on the PDUs, datacenter temperatures in every rack (using the environmental MIB in every switch, any number re-portable by SNMP by any device. Basically, it quickly gets you 95% of what you need, with 5% of the work – just autodiscover and tweak. Then, you come to anything that’s a number, that PRTG doesn’t know how to get. So for that you either write custom probes, etc.. (I do a lot of Advanced HTTPS Push Sensors). So for things PRTG knows nothing about – (Storage free on an enterprise array, channel utilization on another device, outside temperature pulled from a weather service, etc…) A snip of python for each, it’s really easy. The things you’ve mentioned – netflow and syslog are not PRTG’s bread and butter. They’re strangely fitting strapons. They provide some value, but they’re both very limited compared to dedicated products for each. I would never recommend someone buy PRTG /for/ netflow and/or syslog. I have 12,000 active sensors of PRTG’s bread and butter, some penut butter and jelly and I couldn’t be happier. It also contains pickles (netflow and syslog), and while it’s nice to have light pickle from time to time, its not something I want daily, and in no way diminishes the bread and butter. If I wanted pickles all day, I might look somewhere else. (At the risk of stretching the analogy way, way too far…)
uiyicewtf from reddit post
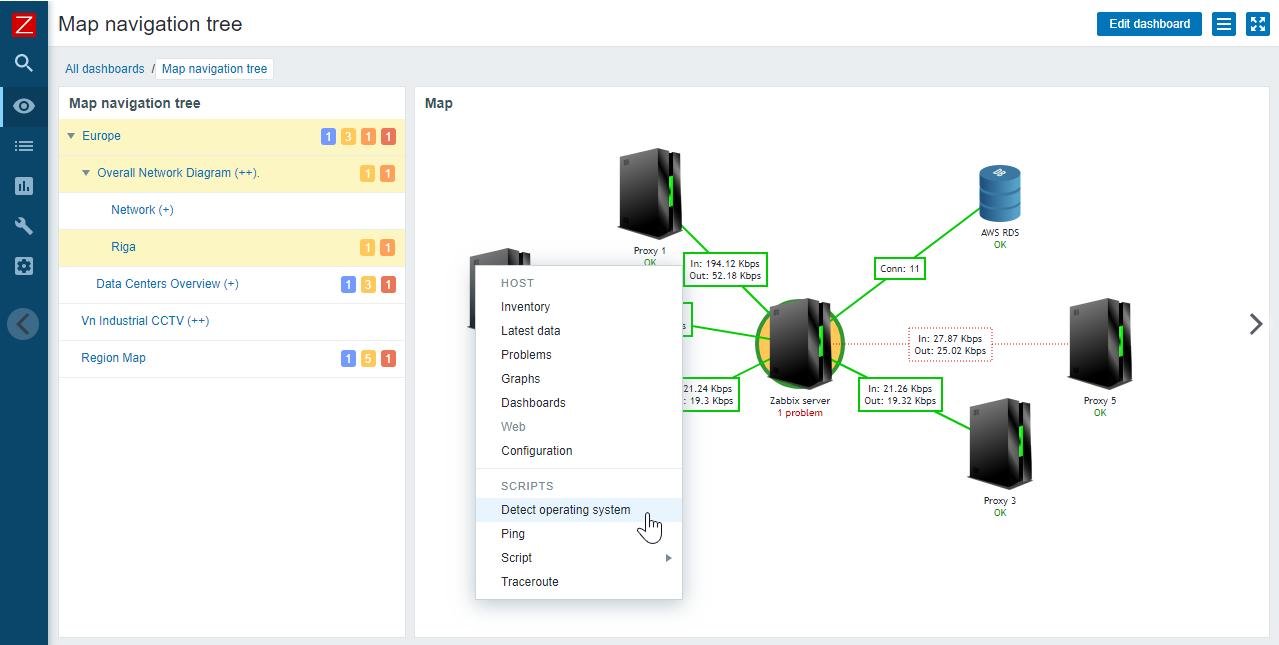
Zabbix can be a bit of a pain to set up (tho massively improved since the 1.x days), but it’s just… perfect. You can create “Low-level discovery” rules which scan the device for specific OIDs and values and can then apply template and even put it in the desired groups. And creating a map of the network topology is extremely satisfying, as you can animate/colour the various elements, or even show small summaries of traffic/utilization per link. Lots of people underestimate how neat this feature is as a high-level overview for your network.
PRTG kinda… works. I mean, it’s easy to get going and, if you have a static environment, doesn’t require looking after. But f*****g hell… Any and all automation is just not there. The absolute worst is its scan-feature – it just picks up any interface, even those which don’t have anything connected. There’s no way to filter (Like, only interfaces with a specific word in the description).
SomeDuderr from reddit post
Conclusion
Zabbix and PRTG are both popular network monitoring tools. Zabbix is open source and offers more features and flexibility, while PRTG is more user-friendly and easier to set up.
Zabbix is a good choice for large enterprises with complex monitoring needs. It offers a wide range of features, including real-time monitoring, alerting, visualization, and capacity planning. However, Zabbix can be complex to set up and manage, and it requires some technical expertise.
PRTG is a good choice for small businesses and organizations that need a simple and easy-to-use monitoring tool. It offers a wide range of sensors and features, and it is easy to set up and configure. However, PRTG does not offer as many features as Zabbix, and it may not be suitable for organizations with complex monitoring needs.
In the end, the best choice for you will depend on your specific needs and requirements. If you require a powerful and flexible monitoring tool with a wide range of features, Zabbix is an excellent option. Alternatively, if you need a simple and easy-to-use monitoring tool that is straightforward to set up and manage, and you have the budget for it, then PRTG is a suitable choice