
Would you like to learn how to monitor VMware ESXi hypervisors, vCenter, VMs, datastores, and clusters (vSphere) with free and open-source monitoring software called Zabbix?
Well then, you are in the right place, because in this tutorial I will show you how to setup VMware monitoring on Zabbix from scratch in just a couple of minutes!
Zabbix is not just for monitoring VMware environment, it can monitor virtually anything like Linux and Windows servers, routers, and switches, websites, databases, docker containers, and more. Learn more about Zabbix on the official website.
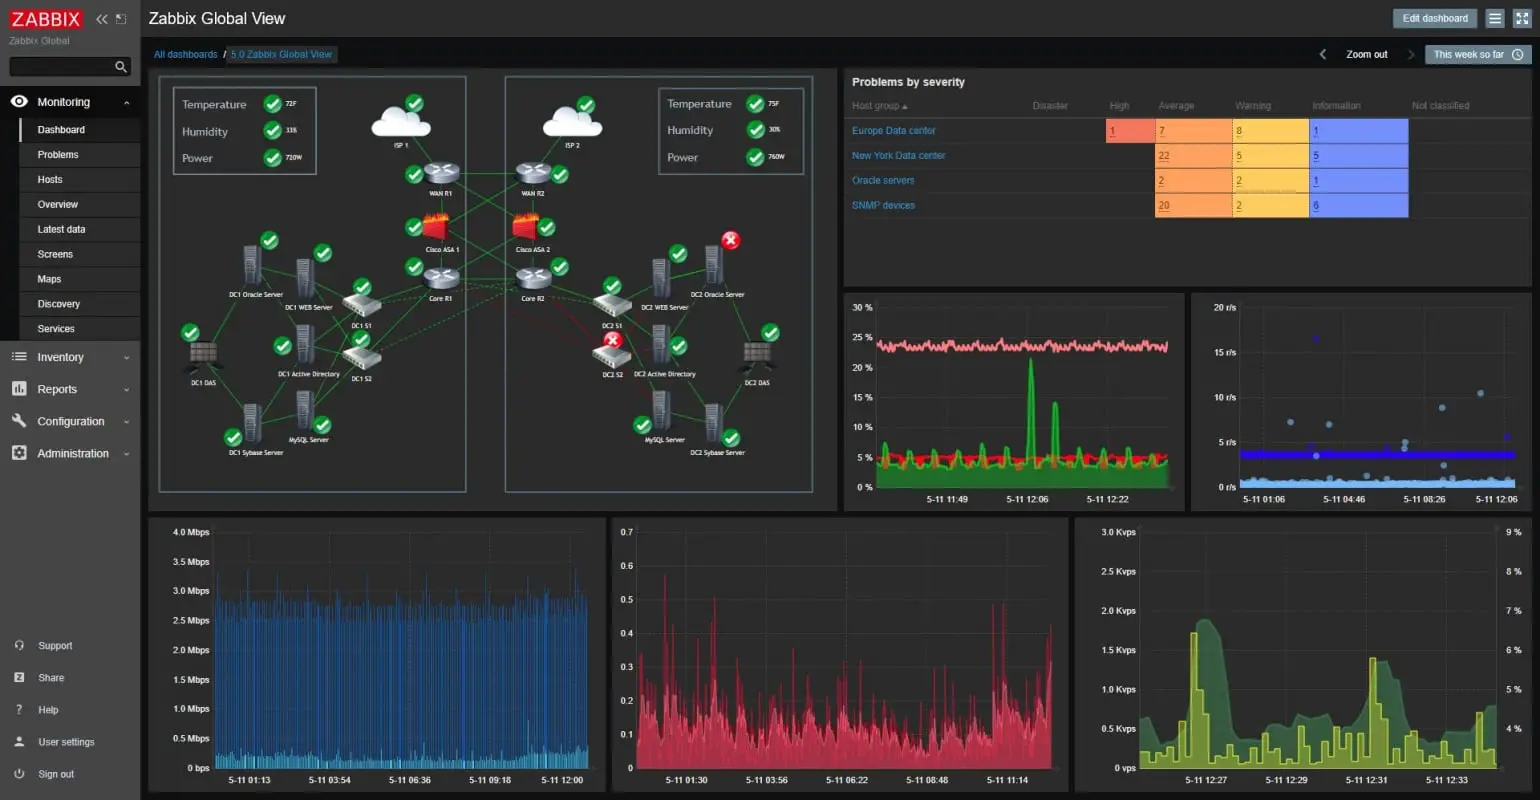
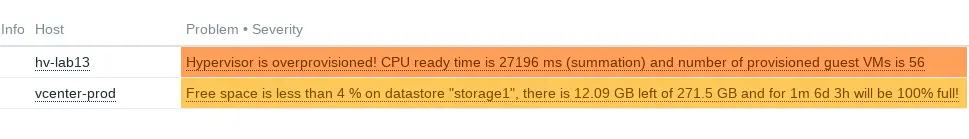
You can configure VMware monitoring pretty quickly on Zabbix using the first three steps of this guide. But I encourage you to read the full guide if you want to learn more about Zabbix and how to create alarms like this one and much much more!
I will use the official Zabbix VMware template that is available in Zabbix starting with version 2.2.0. Check out the table below to find out what metrics will be created by that template.
| VMware Component | Metrics (items) |
|---|---|
| VMware Clusters | Status of cluster |
| VMware Datastores | Datastore average read/write latency Datastore free space, Datastore total size |
| VMware ESXi Hypervisors | Ballooned memory, Bios UUID, Cluster name, CPU cores, CPU frequency, CPU model, CPU threads, CPU usage, Datacenter name, Full name, Health state rollup, Model, Number of bytes received/transmitted, Number of guest VMs, Overall status, Total and Used memory, Uptime, Vendor, Version, Datastore average read/write latency, Datastore free space, Datastore total size, CPU ready time |
| VMware Virtual Machines | Ballooned memory, Cluster name, Committed storage space, Compressed memory, CPU ready, CPU usage, Datacenter name, Guest memory usage, Host memory usage, ESXi Hypervisor name, Memory size, Number of virtual CPUs, Power state, Private memory, Shared memory, Swapped memory, Uncommitted storage space, Unshared storage space, Uptime |
VMware templates had many improvements over the years. Zabbix version 6.0.5 and later has the most up-to-date templates. In this guide, I will use Zabbix VMware templates from Zabbix 6.0.5 version. Consider upgrading Zabbix to 6.0, deleting old VMware templates, and importing the exact templates (right click + save link as…) that I m using in this guide.
Note that the minimum required VMware vSphere version is 4.1, and I can confirm, from the first hand, that Zabbix works without problems with ESXi 6.0, ESXi 6.5, ESXi 6.7, ESXi 7.0 versions.
Sometimes VMware monitoring implementation is done by a person with very little knowledge of the VMware architecture (NOC operator or alike). If you are that person, then here is a brief VMWare introduction just for you!
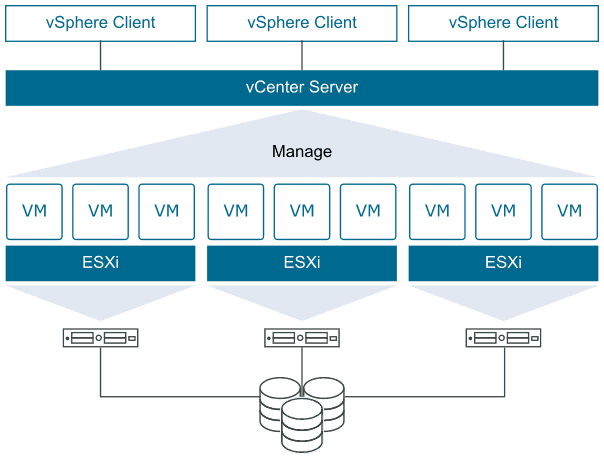
vSphere represents the entire VMware cloud computing virtualization platform consisting of ESXi (hypervisor) and vCenter Server. Its purpose is to let you aggregate and virtualize the resources of the underlying physical hardware, and provide pools of virtual resources to your datacenter.
ESXi (hypervisor) is the virtualization layer that runs directly on physical servers. Its main function is to abstract the resources of the host, such as CPU, memory, and storage capacities, into multiple virtual machines (VMs).
vCenter Server is a central point for provisioning, configuring, and managing the virtual infrastructure. The functionality of vCenter allows you to monitor performance, set up notifications, and control access permissions.
Yadda, yadda, yadda! Enough of lectures! Let’s configure VMware monitoring on Zabbix!
Table of Contents
- Step 1: Install Zabbix monitoring system
- Step 2: Prepare Zabbix and vCenter for VMware monitoring
- Step 3: Discover VMware ESXi, Datastores, Clusters and VMs with Zabbix
- Step 4: Learn how VMware monitoring works in Zabbix
- Step 5: Optimize VMware Datastore monitoring in Zabbix
- Step 6: Optimize VMware ESXi Hypervisor monitoring in Zabbix
- Step 7: Learn about common VMware Monitoring errors on Zabbix
Step 1: Install Zabbix monitoring system
Don’t have Zabbix installed? Don’t worry, I got you covered. You can install Zabbix in 10 minutes. Depending on your operating system (OS) preferences you can follow RHEL, CentOS, Oracle/Alma/Rocky Linux, Ubuntu, Debian, Raspberry Pi (Rasbian) tutorial.
Step 2: Prepare Zabbix and vCenter for VMware monitoring
a) Create a user on the VMware vCenter server
Zabbix is monitoring VMware using API service (SDK), therefore make sure to create a valid user on the VMware platform (vCenter) that Zabbix server can use.
b) Update Zabbix server (or Proxy) configuration file
Note: In case of Zabbix proxy, follow similar steps: edit ‘zabbix_proxy.conf’ and restart the ‘zabbix-proxy’ service
You need to configure Zabbix server for VMware monitoring. Open zabbix_server.conf file with command: “nano /etc/zabbix/zabbix_server.conf” and add these VMware parameters anywhere in the file:
StartVMwareCollectors=3
VMwareFrequency=60
VMwarePerfFrequency=60
VMwareCacheSize=32M
VMwareTimeout=120
StartVMwareCollectors parameter is mandatory, while others are optional. Without VMware collectors, you would receive error “no vmware collector processes started”.
Also, make sure that you have big enough configuration cache or you will receive the error “zbx_mem_realloc(): out of memory“. Start with 256M or more and increase gradually if necessary:
CacheSize=256M
Save and exit file (ctrl+x, followed by y and enter).
In order to apply the new settings you need to restart the Zabbix server, so let’s do that:
sudo systemctl restart zabbix-server
And that’s all you need to prepare before using VMware template in Zabbix. You can move on to the next step, but if you want to know more about the VMware parameters check out the table below.
| Parameter | Range (default) | Description |
|---|---|---|
| StartVMwareCollectors | 0-250 (0) | Number of pre-forked vmware collector instances. This value depends on the number of VMware services you are going to monitor. Use this formula to calculated required StartVMwareCollectors: servicenum < StartVMwareCollectors < (servicenum * 2). Where servicenum is the number of VMware services, for example, if you have 1 VMware service to monitor set StartVMwareCollectors to 2, if you have 3 VMware services, set it to 5. In most cases, this value should not be less than 2 and should not be 2 times greater than the number of VMware services that you monitor. |
| VMwareCacheSize | 256K-2G (8M) | Shared memory size for storing VMware data. You can view how much cache is utilized on the graph “Zabbix cache usage, % used” on the “Zabbix server” host. Start with 32M and then increase VMware cache size gradually if it is utilized more than 60%. |
| VMwareFrequency | 10-86400 (60) | Delay in seconds between data gathering from a single VMware service. This delay should be set to the least update interval of any VMware monitoring item. |
| VMwarePerfFrequency | 10-86400 (60) | Delay in seconds between performance counter statistics retrieval from a single VMware service. This delay should be set to the least update interval of any VMware monitoring item that uses VMware performance counters. |
| VMwareTimeout | 1-300 (60) | The maximum number of seconds Zabbix vmware collector proccess will wait for a response from VMware service (ESXi hypervisor or vCenter). |
Step 3: Discover VMware ESXi, Datastores, Clusters and VMs with Zabbix
In this step, we will create a host in Zabbix with the appropriate macros and template that will be used to initiate and manage VMware monitoring in Zabbix
a) Create a host in Zabbix and setup API credentials
Using the Zabbix frontend, navigate to the “Hosts” menu under the “Configuration” section and then click the “Create host” option to create a host in Zabbix. Define “Hostname”, select the “VMware” template and create a new host group in the “Groups” section (input is arbitrary). Select “Agent” for the interfaces set the IP address to “127.0.0.1” or use the IP address of your vCenter (vSphere).
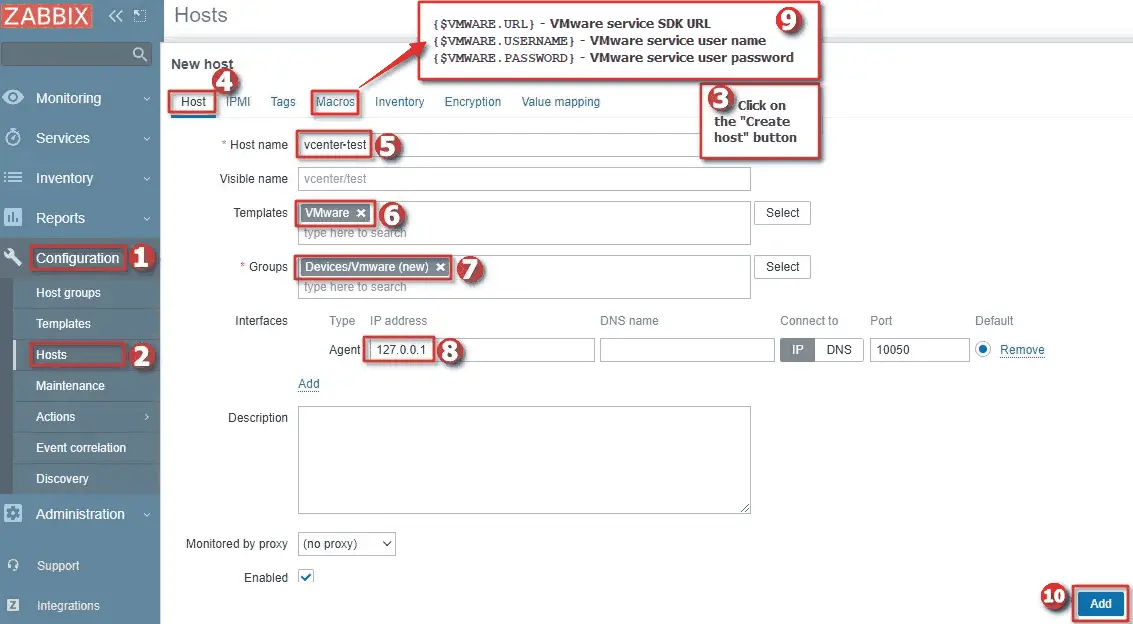
Don’t add a host to Zabbix yet! Navigate to the “Macros” tab to add and configure these 3 macros
{$VMWARE.URL}– VMware service SDK URL (https://server_dns_or_ip/sdk){$VMWARE.USERNAME}– VMware service user name{$VMWARE.PASSWORD}– VMware service user password
Zabbix will use those API credentials to collect performance data from VMware using API (SOAP). Finally, click the “Add” button and you are done with setting up VMware monitoring on Zabbix.
Note that on older versions of the VMware template, macros have different names, e.g. {$URL} instead of {$VMWARE.URL}, and the template has longer name “Template VM VMware“! In that case, consider upgrading Zabbix, deleting old VMware templates, and importing the newer templates (right-click + save link as…) so that you can follow this guide without any errors! Optionally, you can use the old VMware templates, but you need to create macros {$URL}, {$USERNAME}, {$PASSWORD} on the host with the appropriate values.
Keep in mind that the discovery of VMware environment can take up to an hour or two, so be patient or speed up your data retrieval using the “Execute Now” option on the low-level discovery items.
Nice job! Now let’s check check if VMware monitoring is working correctly
b) Check if VMware monitoring is working correctly
After every VMware component is discovered (in an hour or two), check if VMware monitoring is started using the “Latest data” tool.
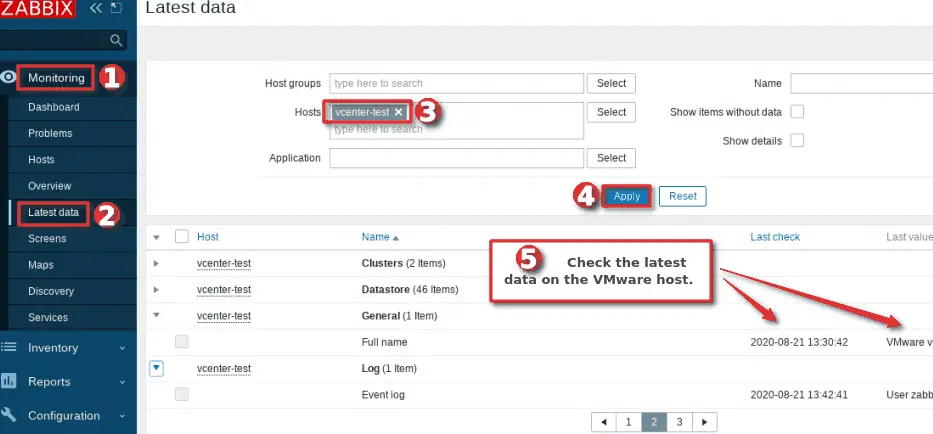
How to check the latest data collected on a host in Zabbix
CONGRATULATIONS!
You have successfully configure VMware monitoring on Zabbix!
No need to change anything else as other steps are optional.
CONTINUE TO LEARN MORE:
Learn how VMware monitoring works on Zabbix
Optimize VMware Datastore monitoring in Zabbix
Optimize VMware ESXi Hypervisor monitoring in Zabbix
Learn about common VMware Monitoring errors
Step 4: Learn how VMware monitoring works in Zabbix
VMware monitoring on Zabbix can be implemented in a few minutes, but it may be challenging for beginners to understand how everything works.
Zabbix has the 3 templates for monitoring the VMware system: “VMware“, “VMware Guest”, and “VMware Hypervisor“, but you only place one template on the host in Zabbix. Who sets the other two templates on hypervisors and VMs? How and when are hypervisors and virtual machines discovered?
There’s that old saying “A picture is worth a thousand words”, so I drew the whole process so that you can understand better how Zabbix monitors VMware virtual environment.
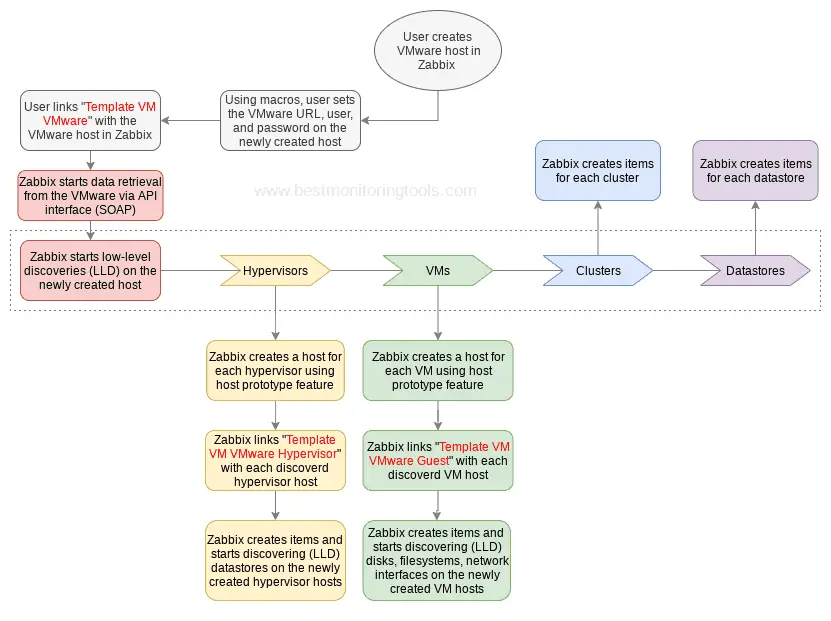
As you can see in the picture, after the user has created a host (with the appropriate template and macros), Zabbix will start collecting data over the VMware API service (SOAP).
Within an hour, Zabbix low-level discovery (LLD) feature will start discovering VMware ESXi hypervisors, datastores, clusters, and VMs.
And now comes the key part, using his low-level discovery host prototype feature Zabbix will create a host for each VMware ESXi hypervisor and virtual machine (VM) and set the appropriate template on them respectively. Now, those templates have their own low-level discovery so within an hour they will start to discover datastores, disks, filesystems, network interfaces on the newly created hosts.
When hypervisor and virtual machines are discovered, those prototypes become actual hosts and they are added to the host groups “Hypervisors” and “Virtual machines” respectively. However, they still belong to an existing host and will take the IP address of the existing host.
There are few things to note about the datastore monitoring, but more about that in the next step.
Note: Consider using the Zabbix agent for server monitoring and disabling limited VMware guest virtual machine discovery. With the Zabbix agent, you can monitor virtually anything at the OS level. Check out this step-by-step Linux and Windows server monitoring guide.
Step 5: Optimize VMware Datastore monitoring in Zabbix
Zabbix VMware templates monitor datastores in two ways:
- Using low-level discovery on the template “VMware” which is linked to the main Zabbix host (created by user) that detects clusters, hypervisors, and virtual machines. With this option, users can view all the datastore statistics on one host in Zabbix (note that this discovery is not present in Zabbix versions prior to 5.0)
- Using low-level discovery on the template “VMware Hypervisor” which is linked by Zabbix to every hypervisor host (created by Zabbix). With this option, users can view on each hypervisor datastores that are relevant to the hypervisor in question. The disadvantage of this option is that if multiple hypervisors share a single datastore, Zabbix will create the same datastore items on all hypervisors that use that datastore.
Both options are enabled in templates by default, and you can leave it as-is if you don’t mind having duplicate metrics.
I recommend keeping both options because in that way you can create triggers for datastore utilization on the template”VMware” and avoid duplicate alarms that would be present if you create the same trigger on the template “VMware Hypervisor“.
On the other hand, datastore items on the template “VMware Hypervisor” allows you to have datastore statistics on each hypervisor that are only relevant to them.
Let’s do some practical work and add some new triggers and items.
a) Configure a trigger (alarm) for datastore utilization
In this step, we will create a trigger on the template “VMware” that will alert us if any datastore has less than 5% free space for the last 15 minutes.
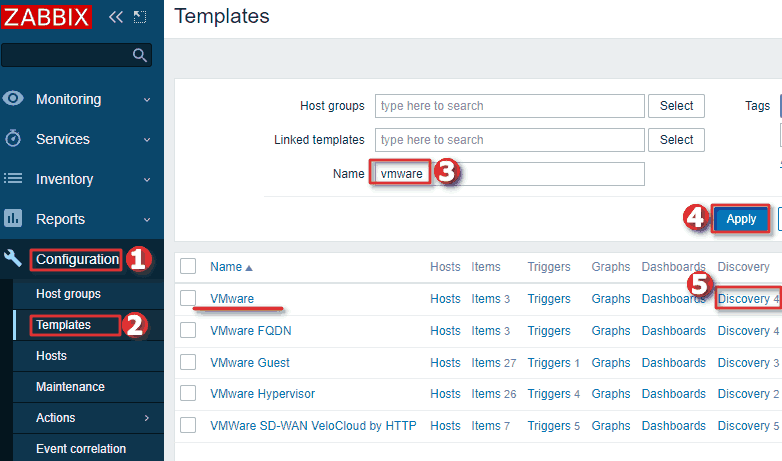
Go to the “Templates” under the “Configuration” section, then using the “Filter” option search for the template “VMware” and click on it’s “Discovery” section.
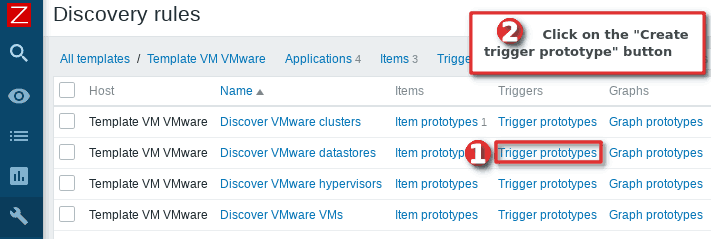
There you will find a list of discoveries, go to the “Trigger prototypes” that belong to the discovery called “Discover VMware clusters” and click on the “Create trigger prototype” button.
Set trigger name to:
Free space is less than 5% on datastore "{#DATASTORE}"
Severity can be whatever you prefer. Add trigger expression using that little “Add” or manually as a text using this expression:
New syntax expression
max(/VMware/vmware.datastore.size[{$VMWARE.URL},{#DATASTORE},pfree],15m)<5

Old syntax expression + old template name(Zabbix 5.2 and older)
{Template VM VMware:vmware.datastore.size[{$VMWARE.URL},{#DATASTORE},pfree].max(15m)}<5
Note, that you can replace the “max(15m)” function with “last()” function in the expression if you would like to receive alarms instantly when datastores reaches 5% free space without that 15-minute condition. Alarms can be spammy sometimes when using the “last” function so I prefer to use the “avg“, “max” or “min” functions (hysteresis).
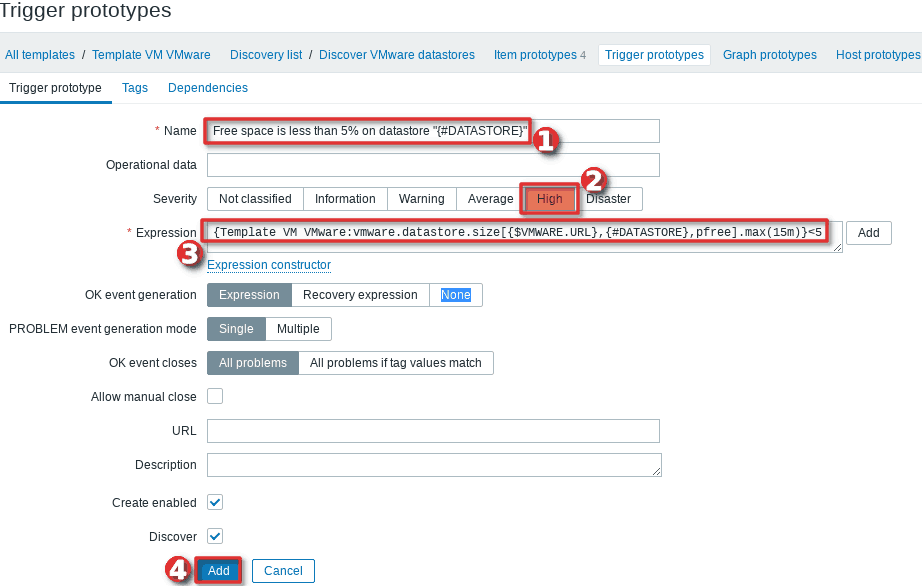
Click that big “Add” button when you’re done configuring the trigger and you are done! Keep in mind that we have created a trigger prototype on the template so it could take up to an hour for Zabbix to create the actual triggers on the host.
What if you want to change the alarm threshold only for some specific datastore?
Eventually, someone will ask you to change that 5% threshold, but only for some datastores that are enormous or very small because we are using percentage for alarm threshold. Is it possible? Of course, everything is possible with Zabbix, we just need to use user macros with context.
First we need to create a user macro on the template “VMware“. Navigate to “Templates” under the “Configuration” section → Click on “ VMware” → Select tab “Macros” → Click that little “Add” button and create a macro {$VMWARE_DATASTORE_UTILIZATION} with value set to 5 → Click on the “Update” button.
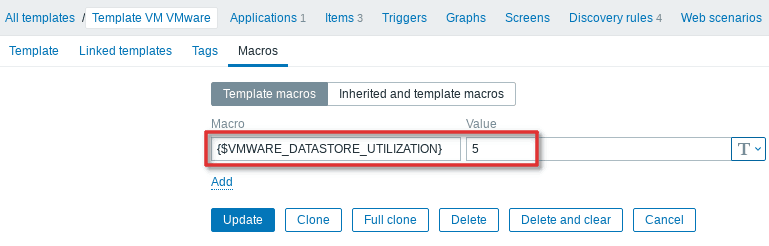
Now whenever in Zabbix we use macro “{$VMWARE_DATASTORE_UTILIZATION}” it will resolve to a number “5“.
Now comes the tricky part, to enable context option we need to use that macro in format {$VMWARE_DATASTORE_UTILIZATION:”some_datastore_name”}. However, we are planning to use that macro in the LLD trigger prototype where datastore is not known until Zabbix creates the trigger. Therefore this macro must be written in format {$VMWARE_DATASTORE_UTILIZATION:”{#DATASTORE}”} when used in low-level discovery (LLD).
Next, go back to the trigger prototype that we previously created and replace the number 5 with our macro so that the trigger name becomes:
Free space is less than {$VMWARE_DATASTORE_UTILIZATION:"{#DATASTORE}"}% on datastore "{#DATASTORE}"
And the expression becomes:
New syntax expression
max(/VMware/vmware.datastore.size[{$VMWARE.URL},{#DATASTORE},pfree],15m)<{$VMWARE_DATASTORE_UTILIZATION:"{#DATASTORE}"}

Old syntax expression + old template name (Zabbix 5.2 and older)
{Template VM VMware:vmware.datastore.size[{$VMWARE.URL},{#DATASTORE},pfree].max(15m)}<{$VMWARE_DATASTORE_UTILIZATION:"{#DATASTORE}"}
Well done! Nothing much has changed except that Zabbix will now use that macro in triggers instead of number 5. However, we can now use context macros and change the alarm threshold only for some datastores
For example, let’s say I need to set the alarm threshold to 3% on one datastore called “main_datastore_3“. To do that I would navigate to “Hosts” under the “Configuration” section → Search for the host that uses template “VMware” → Click on that host → Select tab “Macros” → Click that little “Add” button and create a macro {$VMWARE_DATASTORE_UTILIZATION:”main_datastore_3″} with the value set to 3 → Click on the “Update” button.
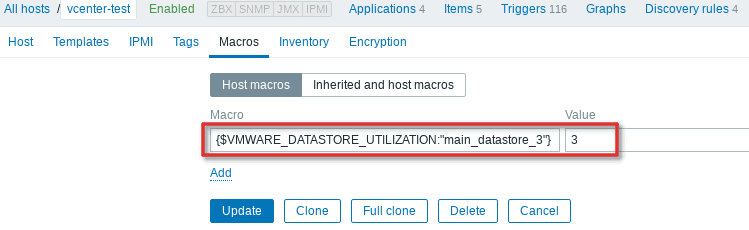
After this change, only the datastore “main data store 3” will use the new alarm threshold of 3% while other datastores will use a threshold of 5% that is defined with macro {$VMWARE_DATASTORE_UTILIZATION} on the template “VMware“. You can add as many context macros as you want or use regex to match multiple datastores.
And that’s all there is to context macros!
b) Create a item that will show datastore utilization in bytes
It is not clear to me why the Zabbix team did not include an item that shows the remaining free space on the datastore in bytes. We have only in percentage in the official template. Who knows, maybe they will add it later in some release. In the meantime, we can easily add that item.
- Navigate to “Templates” under the “Configuration” section
- Using the “Filter” option search for the template “VMware“
- Click on “Discovery” on the template “VMware“
- Click on the “Item prototypes” section that belongs to the discovery called “Discover VMware datastores“
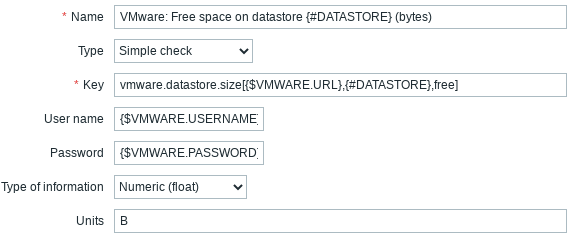
- Click on the current item called “VMware: Free space on datastore {#DATASTORE} (percentage)“
- Don’t change this item, just click the “Clone” option
- Now you can change this new item: set “Name” to “VMware: Free space on datastore {#DATASTORE} (bytes)“, “Key” to “vmware.datastore.size[{$VMWARE.URL},{#DATASTORE},free]” , and “Unit” to “B”
- Click on the “Add” button on the bottom to create a new item.
Keep in mind that we have created a item prototype on the template so it could take up to an hour for Zabbix to create the actual items on the host.
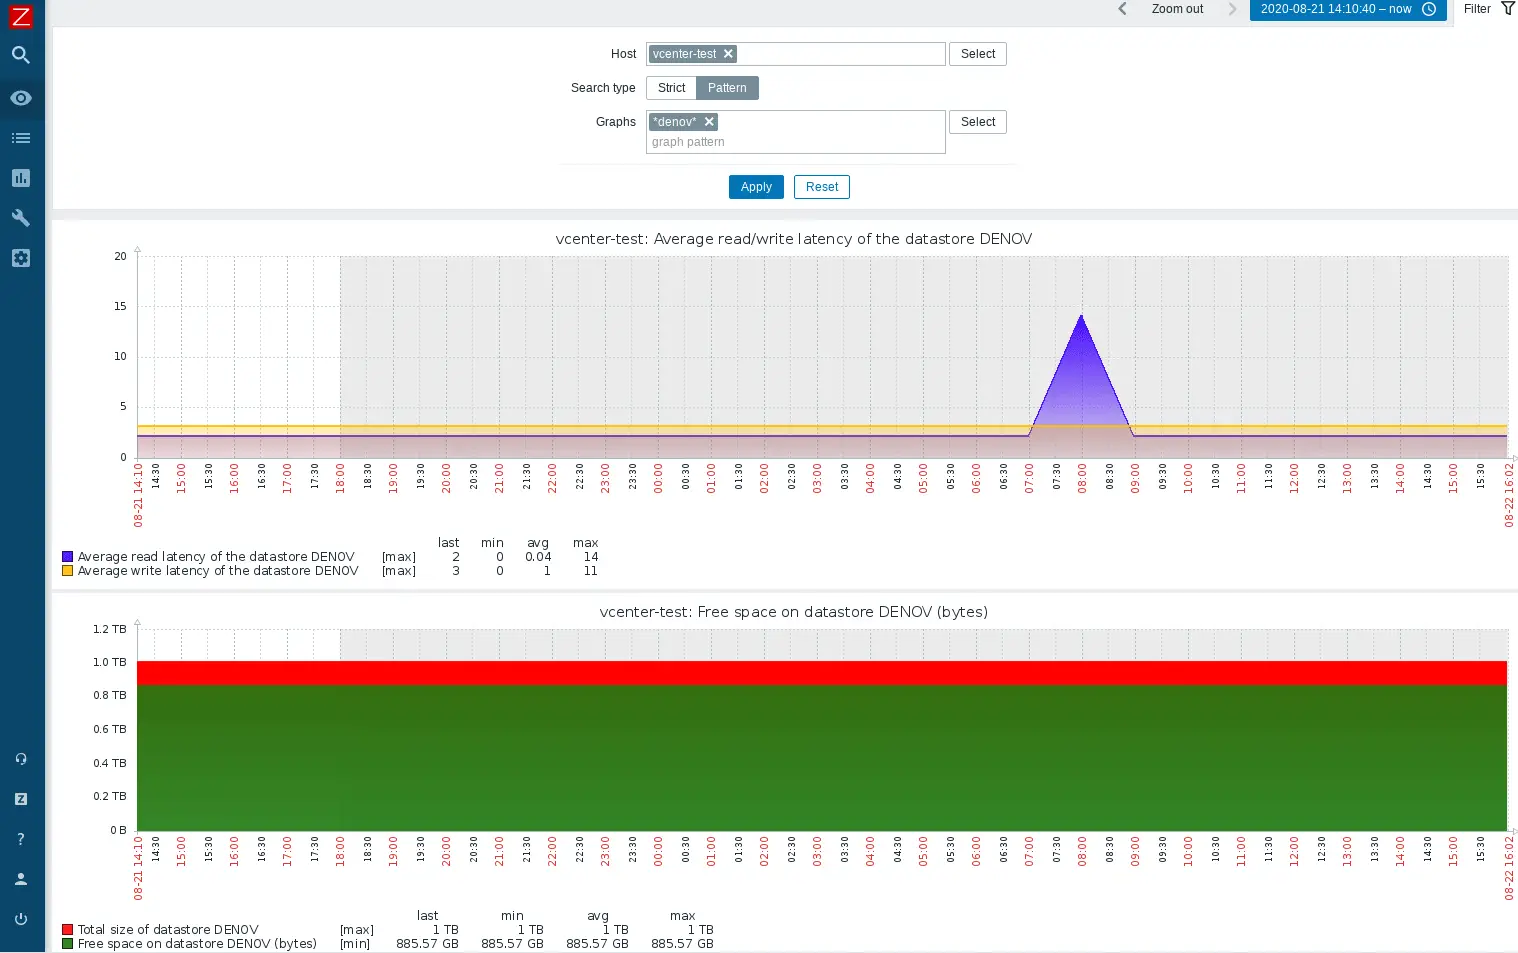
c) Configure graphs for datastore utilization and latency
By default, the official Zabbix template for VMware does not include any graphs, so to view datastore performances you will need to use ad-hoc graphs from the latest data tool. However you can easly update the official templates and add custom graphs.
In this step, we will create utilization and latency graphs for all the datastores using the graph prototype option. With those graphs, you can analyze datastore performances and manage capacity planning for them.
Follow these steps to configure datastore utilization graphs:
- Navigate to “Templates” under the “Configuration” section”
- Using the “Filter” option search for the template “VMware“
- Click on “Discovery” on the template “VMware“
- Click on the “Graph prototypes” section that belongs to the discovery called “Discover VMware datastores“
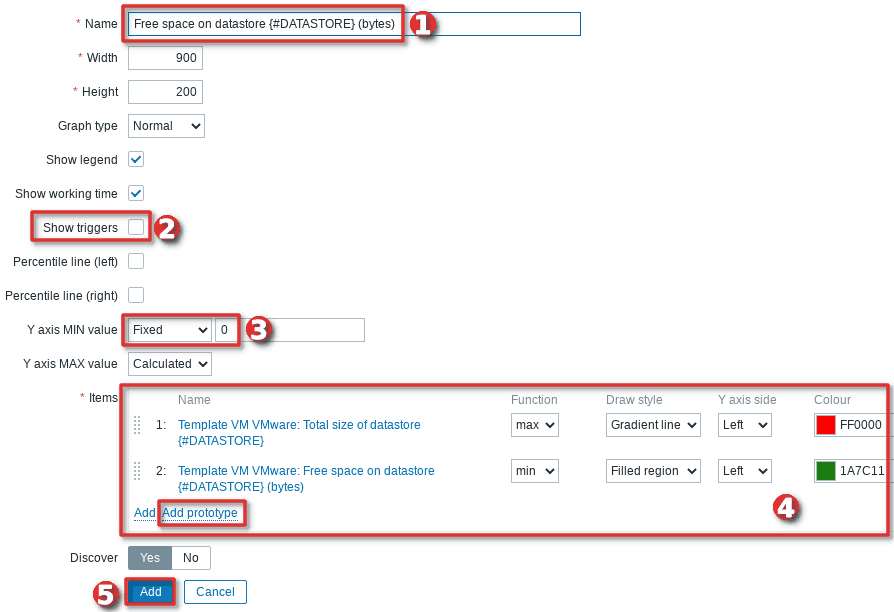
- Click on “Create graph prototype” button in the upper left corner
- Set “Name” to be “Free space on datastore {#DATASTORE} (bytes)“; disable “Show triggers” option; click on “Add prototype” under the “Items” and select “Free space on datastore {#DATASTORE} (bytes)” and “Total size of datastore {#DATASTORE}“, configure “Function” and “Draw” style” like showed in the picture below
- Click “Add” button to create graph prototype.
Now that you know how to prototype graphs, you can create others in a similar way. Here is just one example of a graph configuration for datastore latency statistics:

Keep in mind that we have created a graph prototype on the template so it could take up to an hour for Zabbix to create the actual graphs on the host.
e) Configure a trend prediction for VMware datastore utilization
Wouldn’t it be great if we could know the exact time when some datastore would be full and prevent the problem before accruing? We can achieve that with the Zabbix trend prediction function (timeleft & forecast)!
There is an article on the Zabbix blog where you can learn about trend prediction, so I will spare you the theory. Here, I want to focus on practical work. Let me show you how to create an item that will predict the time when a datastore will be 100% full using the “timeleft” function.
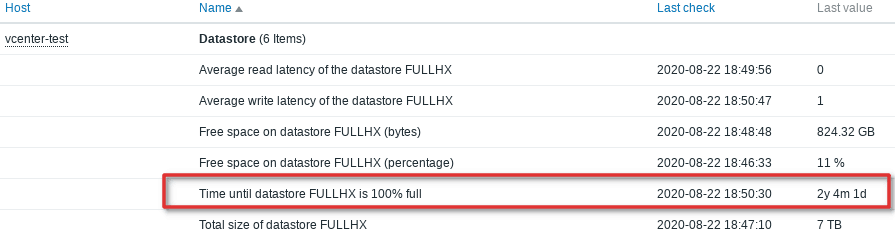
Trend prediction can be configured in triggers and in calculated items, I will use the latter. All you need to do is to create a prototype item just like before but with parameters like in the picture below:
Don’t worry, you don’t need to type that big formula, here are the step-by-step instructions:
- Navigate to “Templates” under the “Configuration” section
- Using the “Filter” option search for the template “VMware“
- Click on “Discovery” on the template “VMware“
- Click on the “Item prototypes” section that belongs to the discovery called “Discover VMware datastores“
- Click on the “Create item prototype” button in the upper right corner
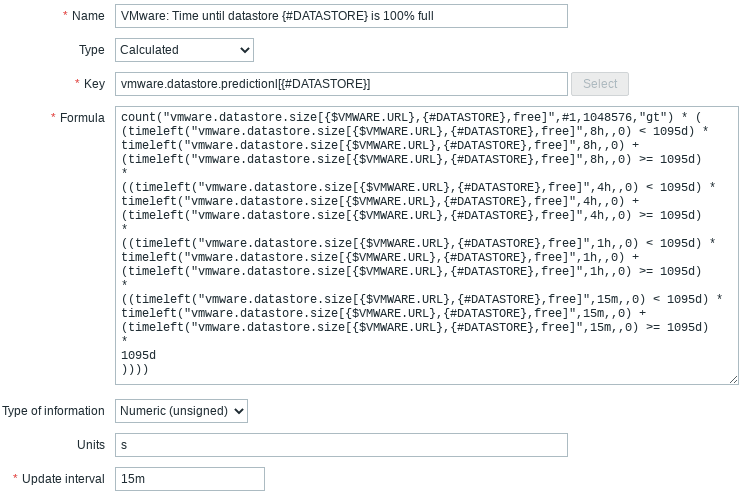
- Configure the item using these steps: set “Name” to be “VMware: Time until datastore {#DATASTORE} is 100% full“, “Type” to “Calculated“, “Key” to “vmware.datastore.predictionl[{#DATASTORE}]“, “Unit” to “s”, “Update interval” to “15m”, and set “Formula” to this:
New syntax expression
count(//vmware.datastore.size[{$VMWARE.URL},{#DATASTORE},free],#1,"gt","1048576") * (
(timeleft(//vmware.datastore.size[{$VMWARE.URL},{#DATASTORE},free],8h,0) < 1095d) * timeleft(//vmware.datastore.size[{$VMWARE.URL},{#DATASTORE},free],8h,0) + (timeleft(//vmware.datastore.size[{$VMWARE.URL},{#DATASTORE},free],8h,0) >= 1095d)
*
((timeleft(//vmware.datastore.size[{$VMWARE.URL},{#DATASTORE},free],4h,0) < 1095d) * timeleft(//vmware.datastore.size[{$VMWARE.URL},{#DATASTORE},free],4h,0) + (timeleft(//vmware.datastore.size[{$VMWARE.URL},{#DATASTORE},free],4h,0) >= 1095d)
*
((timeleft(//vmware.datastore.size[{$VMWARE.URL},{#DATASTORE},free],1h,0) < 1095d) * timeleft(//vmware.datastore.size[{$VMWARE.URL},{#DATASTORE},free],1h,0) + (timeleft(//vmware.datastore.size[{$VMWARE.URL},{#DATASTORE},free],1h,0) >= 1095d)
*
((timeleft(//vmware.datastore.size[{$VMWARE.URL},{#DATASTORE},free],15m,0) < 1095d) * timeleft(//vmware.datastore.size[{$VMWARE.URL},{#DATASTORE},free],15m,0) + (timeleft(//vmware.datastore.size[{$VMWARE.URL},{#DATASTORE},free],15m,0) >= 1095d)
*
1095d
))))

Old syntax expression (Zabbix 5.2 and older)
count("vmware.datastore.size[{$VMWARE.URL},{#DATASTORE},free]",#1,1048576,"gt") * (
(timeleft("vmware.datastore.size[{$VMWARE.URL},{#DATASTORE},free]",8h,,0) < 1095d) * timeleft("vmware.datastore.size[{$VMWARE.URL},{#DATASTORE},free]",8h,,0) + (timeleft("vmware.datastore.size[{$VMWARE.URL},{#DATASTORE},free]",8h,,0) >= 1095d)
*
((timeleft("vmware.datastore.size[{$VMWARE.URL},{#DATASTORE},free]",4h,,0) < 1095d) * timeleft("vmware.datastore.size[{$VMWARE.URL},{#DATASTORE},free]",4h,,0) + (timeleft("vmware.datastore.size[{$VMWARE.URL},{#DATASTORE},free]",4h,,0) >= 1095d)
*
((timeleft("vmware.datastore.size[{$VMWARE.URL},{#DATASTORE},free]",1h,,0) < 1095d) * timeleft("vmware.datastore.size[{$VMWARE.URL},{#DATASTORE},free]",1h,,0) + (timeleft("vmware.datastore.size[{$VMWARE.URL},{#DATASTORE},free]",1h,,0) >= 1095d)
*
((timeleft("vmware.datastore.size[{$VMWARE.URL},{#DATASTORE},free]",15m,,0) < 1095d) * timeleft("vmware.datastore.size[{$VMWARE.URL},{#DATASTORE},free]",15m,,0) + (timeleft("vmware.datastore.size[{$VMWARE.URL},{#DATASTORE},free]",15m,,0) >= 1095d)
*
1095d
))))
- Click on the “Add” button on the bottom to create a new item
That’s it! And remember, you have created an item prototype on the template so it could take up to an hour for Zabbix to create the actual items on the host.
You might be thinking – what the hell is that monstrous formula? To predict the future, I thought that you only need timeleft function used in format “timeleft (sec|#num,,threshold,)” !?
Well, yes and no. I think I owe you a little clarification of that complicated formula. Zabbix official documentation demonstrates how to use timeleft function:
⇒ timeleft(/host/key,#10,0) → time until the item value reaches zero based on the last 10 values
⇒ timeleft(/host/key,1h,100) → time until the item value reaches 100 based on the last hour data
⇒ timeleft(/host/key,1h:now-1d,100) → time until the item value reaches 100 based on one hour one day ago
However, in another document Zabbix states that additional calculations are necessary for prediction to be reliable.
In short, Zabbix has to check multiple time periods to keep up with rapid changes that may occur in resource usage (datastores). In our formula, Zabbix will make a prediction using various periods (8h, 4h, 1h, 15m) and will take into account the worst prediction. If the prediction goes beyond 3 years, Zabbix will set prediction to 3 years i.e 1059d. In that way, you will not receive “thousands of years” prediction on underused datastores.
Read the section “1.3.1 Full interval of “good fit” is needed for the prediction to be reliable” from the mentioned document if you want to know more.
f) Create an advance trigger for datastore utilization
If you have come this far then I must praise your persistence! Well done!
Now you can combine everything you have learn in this tutorial so far and create this wonderful trigger:
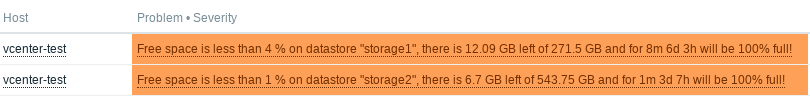
Update the existing trigger that you created before and set trigger “Name” to:
Free space is less than {ITEM.LASTVALUE1} on datastore "{#DATASTORE}", there is {ITEM.LASTVALUE2} left of {ITEM.LASTVALUE3} and for {ITEM.LASTVALUE4} will be 100% full!
And trigger “Expression” to:
New syntax expression
max(/VMware/vmware.datastore.size[{$VMWARE.URL},{#DATASTORE},pfree],15m)<{$VMWARE_DATASTORE_UTILIZATION:"{#DATASTORE}"}
     and
last(/VMware/vmware.datastore.size[{$VMWARE.URL},{#DATASTORE},free])<>-1
     and
last(/VMware/vmware.datastore.size[{$VMWARE.URL},{#DATASTORE}])<>-1
     and
last(/VMware/vmware.datastore.predictionl[{#DATASTORE}])<>-1

Old syntax expression + old template name(Zabbix 5.2 and older)
{Template VM VMware:vmware.datastore.size[{$VMWARE.URL},{#DATASTORE},pfree].max(15m)}<{$VMWARE_DATASTORE_UTILIZATION:"{#DATASTORE}"}
     and
{Template VM VMware:vmware.datastore.size[{$VMWARE.URL},{#DATASTORE},free].last()}<>-1
     and
{Template VM VMware:vmware.datastore.size[{$VMWARE.URL},{#DATASTORE}].last()}<>-1
     and
{Template VM VMware:vmware.datastore.predictionl[{#DATASTORE}].last()}<>-1
As you can see, the trigger name is full of macros. Macros {ITEM.LASTVALUE} from the trigger name will display the latest value from the item that is used in the trigger expression. Here, we are using multiple items, so we added numbers at the end of each {ITEM.LASTVALUE} macro. That way, Zabbix will know to correlate items from the expression with the {ITEM.LASTVALUE} macros from the trigger name.
As for the trigger expression, the first condition in the trigger expression is unchanged. Remember that {$VMWARE_DATASTORE_UTILIZATION:”{#DATASTORE}”} is a user macro that translates to some number. The other three conditions will always result in “True” because they will never receive -1 value. They are there just so that we can display their latest value in the trigger name using {ITEM.LASTVALUE} macros.
Step 6: Optimize VMware ESXi Hypervisor monitoring in Zabbix
a) Create “CPU utilization” item in percentage on VMware ESXi hypervisors
Zabbix did not include an item that shows the percentage of CPU usage of the hypervisor host. No problem, we can easily add that item using Zabbix key called vmware.hv.perfcounter that supports adding custom metrics described in the VMware documentation.
- Navigate to “Templates” under the “Configuration” section
- Using the “Filter” option search for template “VMware Hypervisor“
- Click on “Items” section on the template “VMware Hypervisor“
- Click on the current item called “VMware: CPU usage“
- Don’t change this item, just click the “Clone” option
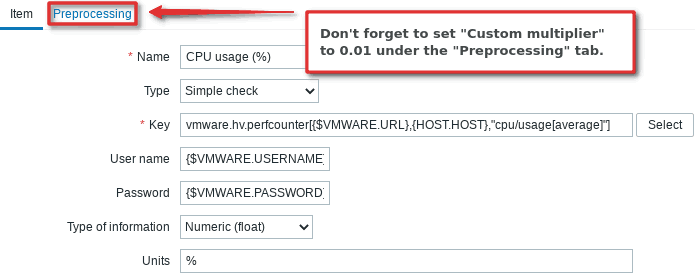
- Now you can change this new item: set “Name” to “VMware: CPU usage (%)“, “Key” to vmware.hv.perfcounter[{$VMWARE.URL},{HOST.HOST},”cpu/usage[average]”] , “Type of information” to “Numeric (float), and “Unit” to “%”
- Set “Custom multiplier” to 0.01 under the “Preprocessing” tab.
- Click on the “Add” button on the bottom to create a new item.
Well done! You have created an item for CPU usage in percentage.
Note that there is another option if you cannot get the data about CPU percentage using the key vmware.hv.perfcounter[{$VMWARE.URL},{HOST.HOST},”cpu/usage[average]”]. Create a new item, set type to “Calculated“, “Key” can be anything, “Type of information” to “Numeric (float)“, and “Unit” to “%”. Then in “formula” section divide CPU Hz (vmware.hv.cpu.usage) by the CPU frequency (vmware.hv.hw.cpu.freq) and multiplied by the threads (vmware.hv.hw.cpu.threads) just like this:
New syntax expression
( ( last(//vmware.hv.cpu.usage[{$VMWARE.URL},{HOST.HOST}]) / last(//vmware.hv.hw.cpu.freq[{$VMWARE.URL},{HOST.HOST}]) )
* last(//vmware.hv.hw.cpu.threads[{$VMWARE.URL},{HOST.HOST}]) ) * 0.1

Old syntax expression (Zabbix 5.2 and older)
( ( last("vmware.hv.cpu.usage[{$VMWARE.URL},{HOST.HOST}]", "0") / last("vmware.hv.hw.cpu.freq[{$VMWARE.URL},{HOST.HOST}]", "0") )
* last("vmware.hv.hw.cpu.threads[{$VMWARE.URL},{HOST.HOST}]", "0") ) * 0.1
The template “VMware Guest” also doesn’t have an item that shows CPU usage of VM quest in percentage. You can create it just like on the hypervisor template, but with a different key, use vmware.vm.perfcounter[{$VMWARE.URL},{HOST.HOST},”cpu/usage[average]”] instead.
b) Create “Memory utilization” item in percentage on VMware ESXi hypervisors
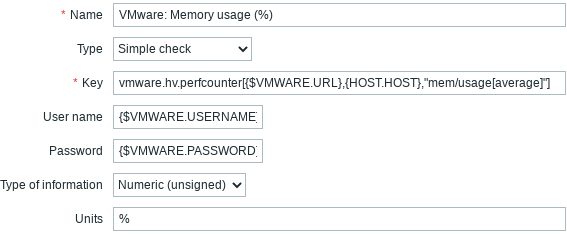
We are also missing an item for memory utilization in percentage in the official Zabbix VMware template. Configure it just like the CPU utilization in percentage but set item name to “VMware: Memory usage (%)” and the key to vmware.hv.perfcounter[{$VMWARE.URL},{HOST.HOST},”mem/usage[average]”] just like in the image below (don’t forget to set “Custom multiplier” to 0.01 under the “Preprocessing” tab).
The template “VMware Guest” also doesn’t have an item that shows memory usage of VM quest in percentage. You can create it just like on the hypervisor template, but with a different key, use vmware.vm.perfcounter[{$VMWARE.URL},{HOST.HOST},”mem/usage[average]”] instead.
c) Create CPU Ready items on VMware ESXi Hypervisor hosts in Zabbix
There is something important on the “VMware Guest“. An item called “CPU ready“. Zabbix documentation defines this metric as the time that the virtual machine was ready, but could not get scheduled to run on the physical CPU during last measurement interval.
With the “CPU ready time” metric you can do capacity planning. In other words, you can detect overprovisioned or underutilized hypervisors and plan virtual machines (VM) management accordingly.
However, Zabbix has this metric only on Guest virtual machines and you can’t view aggregated CPU ready statistics of the virtual machines on each hypervisor. Luckily, we can create that metric using vmware.hv.perfcounter key in Zabbix and VMware performance counters.
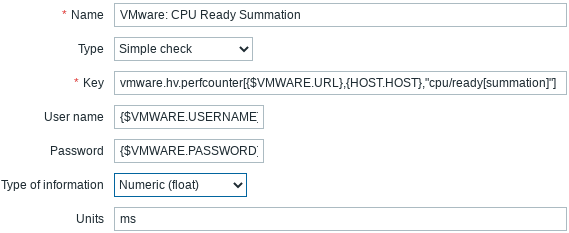
Create “CPU Ready Summation” item on VMware ESXi Hypervisor hosts in Zabbix
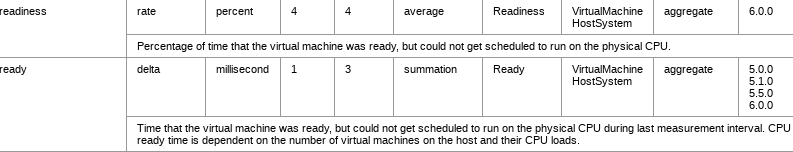
VMware documentation defines “CPU Ready Summation” as “Time that the virtual machine was ready, but could not get scheduled to run on the physical CPU during last measurement interval. CPU ready time is dependent on the number of virtual machines on the host and their CPU loads.”.
Follow these steps to create “CPU Ready Readiness %” item on Vmware ESXi Hypervisor hosts in Zabbix.
- Navigate to “Templates” under the “Configuration” section
- Using the “Filter” option search for template “VMware Hypervisor“
- Click on “Items” section on the template “VMware Hypervisor“
- Click on the current item called “VMware: CPU usage“
- Don’t change this item, just click the “Clone” option
- Now you can change this new item: set “Name” to “VMware: CPU Ready Summation“, “Key” to vmware.hv.perfcounter[{$VMWARE.URL},{HOST.HOST},”cpu/ready[summation]”] , “Type of information” to “Numeric (float), and “Unit” to “ms”
- Update or delete the “Description” section
- Click on the “Add” button on the bottom to create a new item.
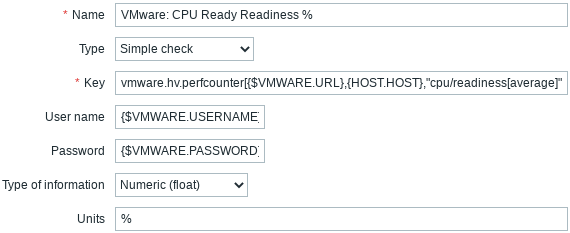
Create “CPU Ready Readiness %” item on VMware ESXi Hypervisor hosts in Zabbix
VMware documentation defines “CPU Ready Readiness %” as “Percentage of time that the virtual machine was ready, but could not get scheduled to run on the physical CPU”.
Follow these steps to create “CPU Ready Readiness %” item on VMware ESXi Hypervisor hosts in Zabbix.
- Navigate to “Templates” under the “Configuration” section
- Using the “Filter” option search for template “VMware Hypervisor“
- Click on “Items” section on the template “VMware Hypervisor“
- Click on the current item called “VMware: CPU usage“
- Don’t change this item, just click the “Clone” option
- Now you can change this new item: set “Name” to “VMware: CPU Ready Readiness %“, “Key” to vmware.hv.perfcounter[{$VMWARE.URL},{HOST.HOST},”cpu/readiness[average]”] , “Type of information” to “Numeric (float), and “Unit” to “%”
- Update or delete the “Description” section
- Click on the “Add” button on the bottom to create a new item.
That’s it! Good job! Now you can view those metrics with the latest data tool.
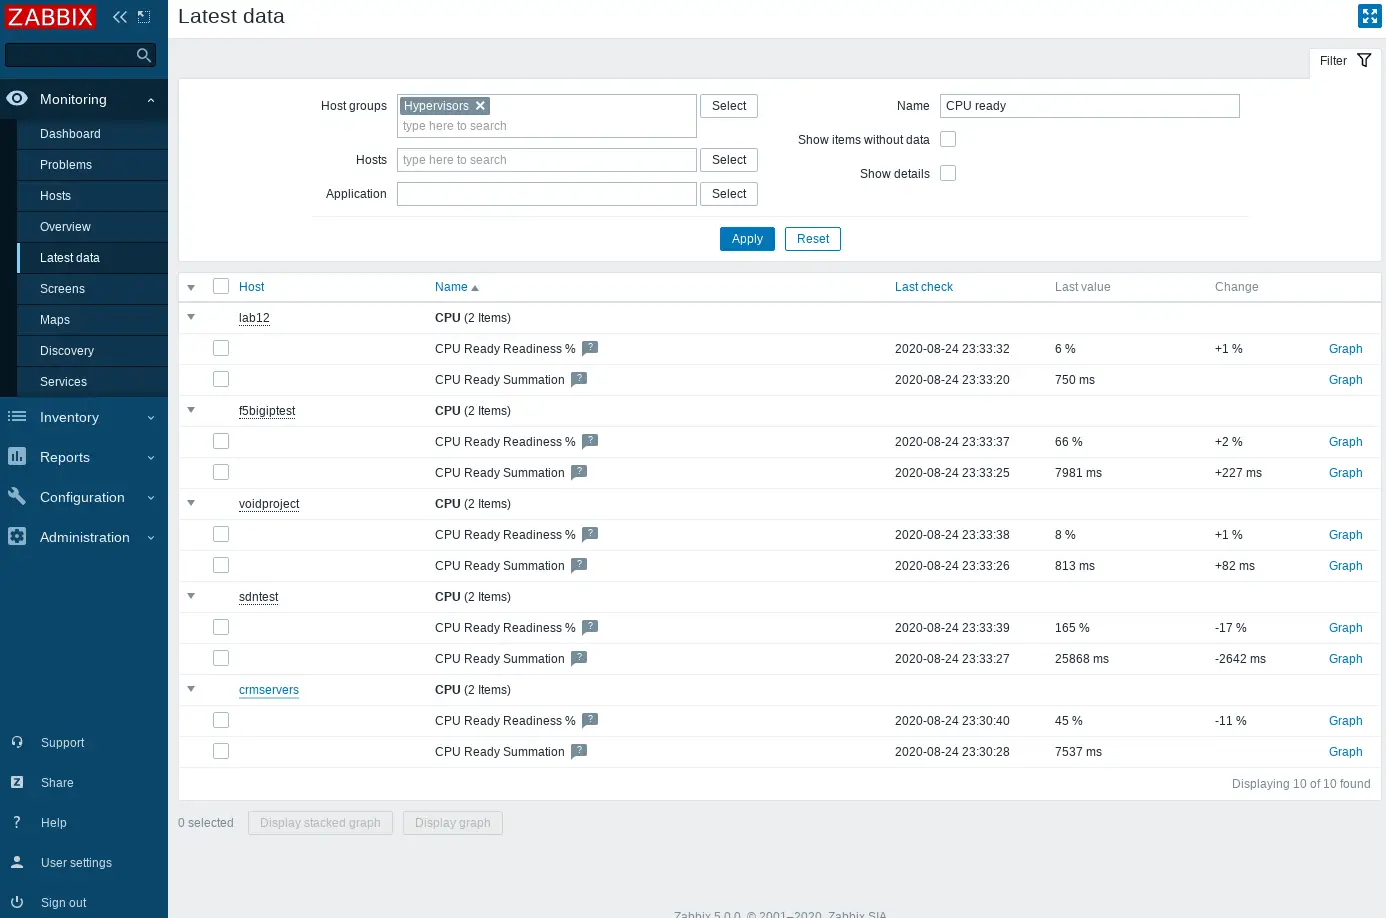
I encourage you to explore additional performance metrics using Zabbix vmware.hv.perfcounter and vmware.vm.perfcounter keys and VMware performance counters and share the ones that prove useful in the comments section.
Step 7: Learn about common VMware Monitoring errors on Zabbix
Error “No vmware collector processes started”
If you receive error “No vmware collector processes started” in the Zabbix log file go back to step “Update Zabbix server configuration file” and double-check everything. Also, make sure that you restart the Zabbix server after updating the configuration.
Error “Performance counter data is not available”
In case of an error “Performance counter data is not available” please make sure that metrics are not made unavailable or turned off by default in recent VMware vSphere versions or if some limits are not placed on performance-metric database queries (ZBX-12094). Also, upgrading Zabbix to the latest version may help.
Error “config.vpxd.stats.maxQueryMetrics’ is invalid or exceeds …”
To fix “Error of query maxQueryMetrics: ‘config.vpxd.stats.maxQueryMetrics’ is invalid or exceeds the maximum number of characters permitted..” error on Zabbix, check value of the maxQuerySize parameter in VMware’s web.xml, then go to the advanced vCenter Server settings and add a config.vpxd.stats.maxQueryMetrics parameter with the same value (more info in this article)
Error “URL using bad/illegal format or missing URL”
Zabbix error “URL using bad/illegal format or missing URL” may occur on items for these reasons:
a) VMware API URL is in an unsupported format or the {$VMWARE.URL} macro value is missing.
Make sure the URL is defined in an acceptable format (https://server_dns_or_ip/sdk) and that the macros are configured correctly. You can also try and use URL https://server_dns_or_ip/sdk/vimService.wsdl instead of https://server_dns_or_ip/sdk (check out this VMware article) – it may help.
VMware templates are using macros {$VMWARE.URL}, {$VMWARE.USERNAME}, and {$VMWARE.PASSWORD}. Make sure that those macros are configured correctly.
On older versions of the VMware template (before Zabbix 5.0), macros have different names, e.g. {$URL} instead of {$VMWARE.URL}, and the template has longer name “Template VM VMware“! In that case, consider upgrading Zabbix, deleting old VMware templates, and importing the newer templates (right click + save link as…) so that you can follow this guide without any errors! Optionally, you can use the old VMware templates, but you need to set macros {$URL}, {$USERNAME}, {$PASSWORD} on the host with the appropriate values.
b) Problem with the certificates on the vSphere/vCenter
Error “URL using bad/illegal format or missing URL” may also occur if you are using self-signed certificates on the vSphere.
Solution is to download the root CA certificate from the vSphere (https://server_dns_or_ip/certs/download.zip). Unzip and go to certs/win, copy the certificate files into the /usr/share/ca-certificates and reconfigure the CA with “dpkg-reconfigure ca-certificates“
Now, that you have your VMware monitored, you can setup Zabbix email notifications and escalations!

This document is excellent. Could you assist me with the following request, in case it’s feasible:
Can we determine which VMs have been idle for a specified number of days?
Identify VMs where CPU/Memory allocation is either excessive or insufficient. This resembles the concept of sprawl in SolarWinds Virtualization Monitor.
Yes, this can be done with advance trigger expressions: https://www.zabbix.com/documentation/6.0/en/manual/config/triggers/expression.
Device/VMware Host Group doesn’t exist on my zabbix. I have 6.4
This guide is for Zabbix 6.0; I will update it when 7.0 arrives. Both 6.0 and 7.0 are stable releases for production systems; I don’t use ‘test’ releases like 6.2 or 6.4. Regards
It would be great if the guide added how to automatically add in the templates for the operating system templates for the guest. I’m working on figuring this out and if I succeed, I will add it in the comments here. I have limited time to work on it, so dropping it and making duplicate objects instead is still a possible outcome.
Invalid key “vmware.hv.perfcounter[{$VMWARE.URL},{HOST.HOST},”cpu/usage[average]”]” for item “VMware: CPU usage (%)” on “VMware Hypervisor”: incorrect syntax near “”]”.
Trying to figure this out when following the article. Will post a solution when I find it.
Hello and thank you for a very comprehensive article on setting up Zabbix monitoring for VMware environments. I’ve used Zabbix to monitor VMware environments for a few years now already and find it very helpful in troubleshooting and post incident efforts.
A question I pose to you and any of the readers : I’ve never been able to create ZAbbix user accounts that are only permitted to see a certain number of VMs in Zabbix and not see everything else that is being inventories and monitored with auto discovery.
Use case : You have a department with a set number of VMs on your platform and you want to give them a monitoring dashboard they can use to troubleshoot and analyze workload performance without allowing them to see other departments workloads and performance graphs.
Has anyone else been able to achieve this?
I selected it from the keys like this:
vmware.hv.perfcounter[url,uuid,path,]
Then added it.
Then went back and added the parameters a piece at a time and it let me update it to the correct settings:
vmware.hv.perfcounter[{$VMWARE.URL},{HOST.HOST},”cpu/usage[average]”]
No idea why but it would not let me just copy and paste that right into the key from the get go.
If you haven’t figured this out yet, here’s one way to do it.
1. Create a host group for the department.
2. Add the servers for the department to the group.
3. Create a user account.
4. Add the user to the group you created and set the permissions.
5. Create a new dashboard and assign the group to the dash so only the server in the group will show on the dash.
Hopefully this will you or someone else.
It’s unfortunate you dont give instruction on how to create a user in vcenter to have sdk access as im stuck on that
how to Discovery of VMware hypervisor network interfaces on zabbix 6.0.6?
Hi,
Getting below error,
Failure when receiving data from the peer. Zabbix 6.0.18 vSphere Client version 7.0.3.01100
Hey everyone need help!
I have 2 Vcenters and the template is active, I see in Latest Data only information about VMware Event Log, Full Name, Version I do not see what is in Discovery
The user I use is Read Only, could that be the reason?
It doesn’t create new hosts, it doesn’t monitor the CPU or DATASTORE anyone know why?
Thanks
Excellent article! I followed this guide on a Zabbix 6.4 + VMware 6.7 and everything worked fine at 1st attempt.
The items explained in Step 6 of the tutorial are already there in the VMware 6.4 templates, so I skipped that part.
Thank you!
Thank you very much for this wonderful tutorial! 🙂
Thanks! This helped me so much
Looks nice 🙂
For PRTG it can be done in two clicks but sure PRTG is not free.
So, it depends how much your time cost.
And one more thing, after that you need to spend who knows how much time to configure dashboards to get good visibility. I just start looking how to use Zabbix for monitoring and after several days I can say that I don’t like it or maybe I just don’t know how to cook it.
Give it time, it will grow on you 🙂
Thanks for the great additions here! Something I see missing for my use case is how to sort VMs into host groups by name. for instance, my database servers have DB in the name. I want to create a Host group called Database Servers and have the database hosts automatically placed in that group. This way I can send alert emails to the database admins instead of everyone. Can that be done?
I am getting those errors “URL using bad/illegal format or missing URL”, tried first approach (a) but didn’t fix, now I am trying the next one (b) but since I am using only an ESXI node instead of a vCenter, I don’t know how to get the root CA certificate.
Do you know how can I download the root CA certificate of ESXI 7.0.3?
Didn’t notice that I should have provide on all vmware related templates, the user name, password and url.
After adding those there, all starts working.
Thanks a lot for the great tutorial!!!!
Hello,
See this: https://kb.vmware.com/s/article/1003218
So it should be: https://IP_OR_FQDN/sdk/vimService.wsdl instead https://server_dns_or_ip/sdk
On what version is your VMware? I m using /sdk and everything works fine.
Hello, I have a problem with UUID, I am using zabbix 5.4 and the latest template.
For example:
item: vmware.hv.hw.uuid[{$VMWARE.URL},{HOST.HOST}] return: Unknown hypervisor uuid.
Multiple items return this error.
Anyone have any idea what could be causing this error?
It Looks like Zabbix has changed something in templates in 5.4.x. I will check and update the tutorial.
Thank you Aldin!
I followed this guide on 3 different installs of Zabbix 5.4 and can not get this to work. The logs provide no indication of errors even after increasing the log level. The guide should be updated to reflect the menus in 5.4 since templates and macro names are different. Spent two days trying to trouble shoot this no help from the forums or google searches, that I could find. I can’t upload images to show screen shoots. I posted on the forum if you are able to look https://www.zabbix.com/forum/zabbix-help/437877-vmware-no-communication.
Thank you for your time.
Hi there,
Superb article but before I start adding my vCenter for Zabbix monitoring, I have one big remaining question:
I’m already monitoring most of my VM servers (Linux & Windows) with the agent, what will happen if I had my vCenter to Zabbix, will the discovery add a duplicate host?
I’m really wondering because I don’t want to end up with a mess.
If there is a way to block the VM discovery, that is fine, but how would you do that?
Thanks in advance
Thanks a lot.
I’m using the latest version of Zabbix, 5.4 and the latest template from https://git.zabbix.com/projects/ZBX/repos/zabbix/browse/templates/app/vmware
I have add the HOST vCenter Server and then linked to the Template name VMWare.
In the list of the Zabbix Hosts, appears only few VM with the name: Discover VMware VMs and my two ESXi Server with the name of Discover VMware hypervisors
It’s normal?
Why there are only few VMs? I have in my environment 20 Vms. The discovery services only show 10 Vms
Thanks
Thanks to your article I was able to setup my VMware infrastructure monitoring in a breeze 🙂
Well written and easy to understand!
But, I encountered a problem. Since I’m using the release 5.4.2, as you may know, there is a new formula syntax and I’m not able to configure the trend prediction about datastores utilization.
I tried to figure out myself looking into the Zabbix documentation/articles with no success.
Did you manage to find a working formula using the new syntax?
Thank you in advance and congratulations!
Thx for the info! I updated the tutorial. Regards
Hi,
I followed all the steps but for “vmware.hv.sensor.health.state[{$VMWARE.URL},{HOST.HOST}]”
I have “the value is not available”
What am I doing wrong?
Thnk
Vale
Some versions of vCenter do not support all metrics or you need to play around with vCenter settings.
i have import template vmware on zabbix 5.4 and i got error on vmware hypervisor like this “Cannot create group: invalid group name “” now i cant monitor my server from grafana.
Thanks
For Zabbix 5.4+ use this template:
https://git.zabbix.com/projects/ZBX/repos/zabbix/browse/templates/app/vmware
Man this article save me, i realy needed a way to collect CPU and Memory in percentage.
You realy help me
congrats from Brazil.
Thank you for your valuable article,
I need help to arrange CPU and Memory metrics in descending order obtained for ESXi Hypervisor.
Where are you trying to sort metrics? On the “Latest data” section on the frontend?
Hello There,
this is a great article, I have trouble in discovering the VMs
I have created a new Host and added the Macro (URL,Username.Password) at host level and attached the Template VM VMware to it. I am adding the host via Proxy. So made configuration changes on the zabbix-proxy.conf file.
The problem is when I check the Discovery rules on the Host the info says couldn’t resolve Hostname. I have manually added Host entry of the end device on Proxy server as well as Zabbix Server. Still the same error. I even tried to add the Host Name as IP address of the devices, but still same error. I am not sure which Host name it is trying to resolve. Can you please help me on this.
Zabbix Version: 5.0.3
First, check the URL macro. Try to set the IP address in the URL of the vCenter (not Exsi host!). Second, on the host interface set the IP address of the vCenter and make sure that the “IP” option is selected on that interface.
Thank you so much for this article, it really helped us get our monitoring set up. I’d really appreciate some help with one or two issues with items if possible? For some reason i cant get any disk perf counters to work, it returns Performance counter instance was not found. CPU/Mem working fine. Some examples:
vmware.hv.perfcounter[{$URL},{HOST.HOST},”disk/commandsAborted[summation]”]
vmware.hv.perfcounter[{$URL},{HOST.HOST},”disk/busResets[summation]”]
vmware.hv.perfcounter[{$URL},{HOST.HOST},”disk/totalLatency[average]”]
Also the ‘free space on datastore (bytes) is working for most datastores but on the larger ones i’m seeing error ‘Value 2181598486528 is too small or too large’
Hi. What Zabbix version are you using? I had that error on some 4.0.x releases, it was resolved when I upgraded to a 4.0.8.
Regarding the error “Value is too small or too large”, to handle larger values, try to set “type of information” on the item to be “Numeric(unsigned)”.
Hi,
very nice job.
i’ve got bad URL problem too but my problem was not due to macros.
this message can appear with self-signed certificates on the vsphere.
How to resolve : download the root CA of the vsphere
wget –no-check-certificates https://IP_or_FQDN/certs/download.zip
unzip and go to certs/win
copy the crt files into the /usr/share/ca-certificates
reconfigure the ca with
dpkg-reconfigure ca-certificates
check your crt and validate
now you can reach the server 🙂
Thx for that information :). I will update the tutorial as soon as possible!
Hi Aldin,
regarding the percentage, it seems also affecting the memory session above.
I think we will need 0.01 as custom multiplier in “VMware: Memory usage (%)”
Cheers,
Tony
I have updated the tutorial, thx for reporting!
Hi,
May I ask :
I have setup 2 versions of the Hypervisor CPU usage (%) and to see the difference. It turns out:
1)Using the key, “vmware.hv.perfcounter[{$VMWARE.URL},{HOST.HOST},”cpu/usage[average]”]”
the return value will be like this:
VMware: CPU usage (%) [all] last: 43% min: 19% avg: 61.3496% max: 442%
2)Using the “Calculated” way: ( ( last(“vmware.hv.cpu.usage[{$VMWARE.URL},{HOST.HOST}]”, “0”) / last(“vmware.hv.hw.cpu.freq[{$VMWARE.URL},{HOST.HOST}]”, “0”) )
* last(“vmware.hv.hw.cpu.threads[{$VMWARE.URL},{HOST.HOST}]”, “0”) ) * 0.1
the return value will look more relistic.
VMware: CPU Usage (%) [all] last: 0.1898% min: 0.05564% avg: 0.2061% max: 1.3025%
That esxi host is a standby server so most of the time is idle.
Am I missing something?
Thanks
Tony
Thank you for reporting that error! Somehow one step on how to set “Custom multiplier” to 0.01 under the “Preprocessing” tab was missing! I have updated the tutorial! Now both methods for monitoring CPU usage as a percentage on hosts should return similar values.
Thanks Aldin,
It works!
Cheers,
Life saver! Thank you very much!
Amazing job, WELL DONE !
So we do not UUID macro for monitoring vmware ESXI in zabbix 5.0?
I am getting error as ” Session is not authenticated” for the items after an hour .
Any suggestion for this?
If you are monitoring ESXi hosts via vCenter then there is no need to use {$UUID} macro. That macro is not supported by the official templates – you need to change that template or download a standalone ESXi template.
On the other hand, if you are monitoring ESXi hosts via vCenter then the error “Session is not authenticated” most often occurs due to a wrong URL, user, or password. Check if you are using HTTPS or HTTP and if the user is created correctly on vCenter, and finally carefully enter the vCenter URL, user and password in the macros.
Does anyone have Status: “Unsupported”, Info: “Received response has no valid XML data”? after configuring the first three steps from this tutorial?
I also installed everything I needed using the tutorial for Ubuntu (Steps 1 -> 5)
I am a complete beginner and I am not sure what to do next.
I appreciate any help!
Hi Anna,
Looks like that you didn’t configure the Zabbix configuration file correctly or you did but forgot to restart the Zabbix server.
Make sure that you set this in your zabbix_server.conf file:
StartVMwareCollectors=3
VMwareTimeout=120
And restart the Zabbix server afterward. Also, check that the vCenter/ESXi user and password is properly configured.
Regards
Awesome tutorial!
Any idea why Zabbix wouldn’t create these triggers by default? It seems like an incomplete solution to collect items without triggering on basic things like running out of disk space!
Thx! It’s hard to create triggers that will fit any Zabbix installation, so I guess they just gave up on triggers because optimizing them is very time-consuming.
Can you also do a guide on getting memory utilization in percentage?
Thank you
I have added steps on how to create an item for the memory utilization on the hypervisors – check out the section “Optimize VMware ESXi Hypervisor monitoring in Zabbix”.
Great Article, I will use your trend configuration for monitor Disk space free. Thanks!
One Question, do you find usefull that “VMware: HOST has been restarted (uptima <10m)" if I manually close, it will trigger again and again and i just anoying.
Thx! Not all Zabbix environments have the same alarm priorities. If that alarm is irrelevant to you, turn it off at the template level.
Modify trigger expression to include greater than zero condition (for when VM is powered off or suspended value)
{Template VM VMware Guest:vmware.vm.uptime[{$VMWARE.URL},{HOST.HOST}].last()}0
This is amazing! Thank you! Always a pleasure to have fresh and thought-out Zabbix material out there.