
I’ve been using Zabbix for more than a decade, and one thing that really stands out to me about this tool is its extreme flexibility. However, all of that functionality can be a bit overwhelming for beginners, even with the fantastic Zabbix documentation.
That’s why I created the blog BestMonitoringTools.com and filled it with tutorials on a variety of topics, including a guide for installing and optimizing Zabbix, monitoring network devices, Windows and Linux operating systems, VMware systems, and much more.
My goal was to introduce readers to Zabbix gradually, starting with simple tasks like adding a device to be monitored and working our way up to more complex tasks such as trend prediction, hysteresis, and anomaly detection.
I also wanted to ensure that all the tutorials on my blog are always up-to-date, so whenever the Zabbix team releases a new version, I try to update all the tutorials within a few days to reflect the changes from the new version.

By the end of this tutorial, even those with no prior experience with Zabbix will be able to easily install, configure, and optimize Zabbix, as well as set up a database, proxy server, and agents, and have it monitoring their entire IT infrastructure in just a few short hours.
So, if you’re ready to get started and become a Zabbix pro, let’s dive in!
Table of Contents
Zabbix tutorials
I have compiled a table of all the best Zabbix tutorials from bestmonitoringtools.com below for those who want to jump right in:Installation Install the latest Zabbix on CentOS, RHEL, Oracle/Alma/Rocky Linux, Ubuntu, Debian , or Raspberry Pi Datacenter Monitoring The Ultimate VMware Monitoring Guide
Linux/Unix Server Monitoring With Zabbix-Agent
Windows Server Monitoring With Zabbix-AgentNetwork Monitoring How to Monitor Cisco Switch or Router Visualization How to Create Interactive Zabbix Maps Administration Setup Zabbix Email Alerts & Escalations Optimization Install Zabbix-Proxy on CentOS, RHEL, Oracle/Alma/Rocky Linux, Ubuntu, Debian, or Raspberry Pi
How to optimize Zabbix MySQL / MariaDB database?Maintenance The Ultimate Guide to Upgrading Your Zabbix Server
How to Import SNMP MIB to Zabbix?
Zabbix installation
There are several ways to install Zabbix, including using cloud images, containers, appliance, sources, and packages. However, in this tutorial I will use the traditional method and show you how to install Zabbix using a package. Please choose the instructions for your preferred operating system below:
- Tutorial – Zabbix Installation Guide for CentOS, RHEL, Oracle/Alma/Rocky Linux
- Tutorial – Zabbix Installation Guide for Ubuntu
- Tutorial – Zabbix Installation Guide for Debian
- Tutorial – Zabbix Installation Guide for Raspberry Pi OS
The basic installation of Zabbix takes about 10 minutes, but I’ve expanded the tutorial for those who want to learn more. These additional instructions cover optimizing the Zabbix server, partitioning and optimizing the database, configuring SELinux for those using RHEL-based operating systems, and maximizing performance on the Raspberry Pi (if putting cool software on a tiny device is your thing).
I’ve also included information on upgrading Zabbix and managing its services and how to setup SNMP traps. And if you need to install Zabbix using a different method, please check the installation page in the official Zabbix documentation.
Datacenter monitoring
a) Window/Linux monitoring
Now that you have Zabbix installed, it’s time to start using it to monitor your operating systems. Zabbix easily integrates with both Windows and Linux/Unix servers, discovering and monitoring them with minimal setup. Monitor essential metrics such as CPU and memory usage, disk space utilization, network traffic, as well as complex system parameters and software applications.
Let’s get to work! Use the tutorials linked below to set up monitoring for Windows, Linux, and Unix systems.
Tutorial – Linux/Unix Server Monitoring With Zabbix-Agent
Tutorial – Windows Server Monitoring With Zabbix-Agent
By following these tutorials, you can ensure the smooth functioning and optimal performance of your servers, and quickly address any issues that may arise.
b) VMware monitoring
If you have VMware in your datacenter, you have the option of monitoring your Windows and Linux servers through it. This approach simplifies the process as you only need to connect Zabbix to the vCenter API, and it will automatically start monitoring all virtual machines. However, it should be noted that this method has limitations compared to using a full-fledged Zabbix agent.
However, VMware monitoring plays a crucial role in monitoring the performance and utilization of hypervisors and datastores.
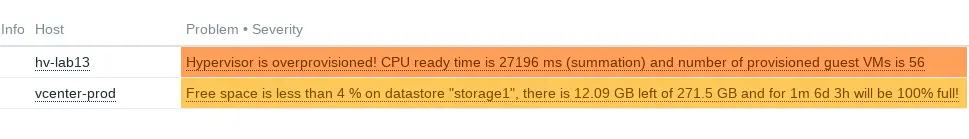
This information is vital for capacity planning as it provides visibility into the usage of resources, allowing organizations to optimize usage and plan for future needs. Let’s set up monitoring for hypervisors and datastores with the help of the tutorial below.
Tutorial – VMware Monitoring with Zabbix
With insights gained from monitoring, organizations can detect overprovisioned or underutilized hypervisors and datastores, and make informed decisions about virtual machine management and scaling their environment.
c) Website monitoring
Website monitoring is an essential aspect of IT operations, even though it may not be directly related to datacenters. In the tutorial linked below, we will cover the basics of website monitoring and provide ways to automate the process for those who need to monitor a large number of websites, making it more manageable.
Tutorial – Zabbix Website Monitoring
In summary, we have discussed the monitoring of operating systems, VMware, and websites. However, if you wish to expand Zabbix monitoring abilities and monitor other systems in your datacenter, I recommend visiting the Zabbix integration page for additional resources and information. This page offers comprehensive coverage of various technology monitoring options, including Docker containers, Kubernetes, storage, databases, and more.
Network monitoring
Great job so far. I trust the datacenter section wasn’t too challenging. Now, let’s move on to monitoring network devices such as Cisco, HP, Juniper, Huawei, Mikrotik, Dell, F5, Ubiquiti, ZYXEL, Arista, Brocade, TP-LINK, and others. This should be straightforward to set up as Zabbix offers in-built templates for monitoring devices from these vendors.
Check out my tutorial on network monitoring, linked below, and let’s get to work!
Tutorial – How to Monitor Cisco Switch or Router?
In that tutorial, you will learn how to configure a Cisco device to support SNMP and add it to Zabbix as a host. Furthermore, you will learn how to automate this process by creating discovery rules and actions that automatically add network devices to Zabbix.
Keep in mind that the Zabbix integration page offers support for a wide range of network device types.
Mail alerts and escalations
You have successfully installed Zabbix and configured it to monitor your Linux and Windows servers, VMware, routers, and switches. Now, it would be wise to set up email notifications from Zabbix in case of problems on those systems.
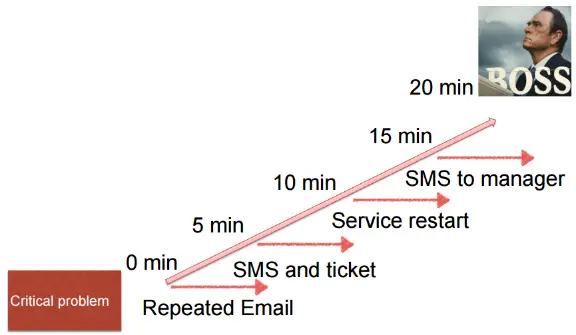
In the tutorial, linked below, we will configure Zabbix alerts so that any issues are forwarded to administrators via email.
Tutorial – Setup Zabbix Email Alerts & Escalations
Setting up Zabbix email alerts is relatively easy and can be completed in a short amount of time by following the initial steps of the tutorial. However, for more advanced topics like escalations, customizing email content, delaying email alerts, optimizing notifications in large environments, troubleshooting common notification errors, and more, it is recommended to read the full tutorial.
Zabbix maps
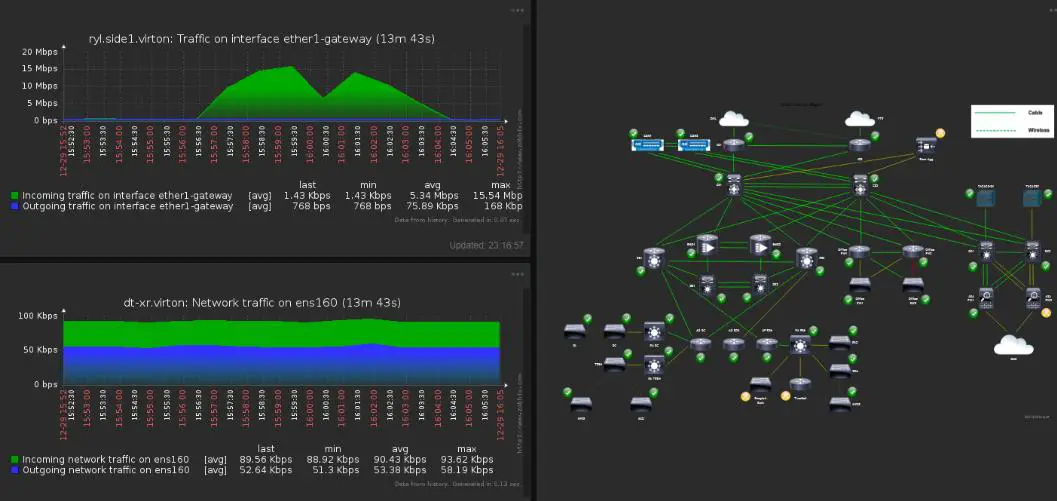
Zabbix maps are one of many tools that can be used to visualize the collected data in Zabbix. They are often overlooked because not many people are aware of their potential.
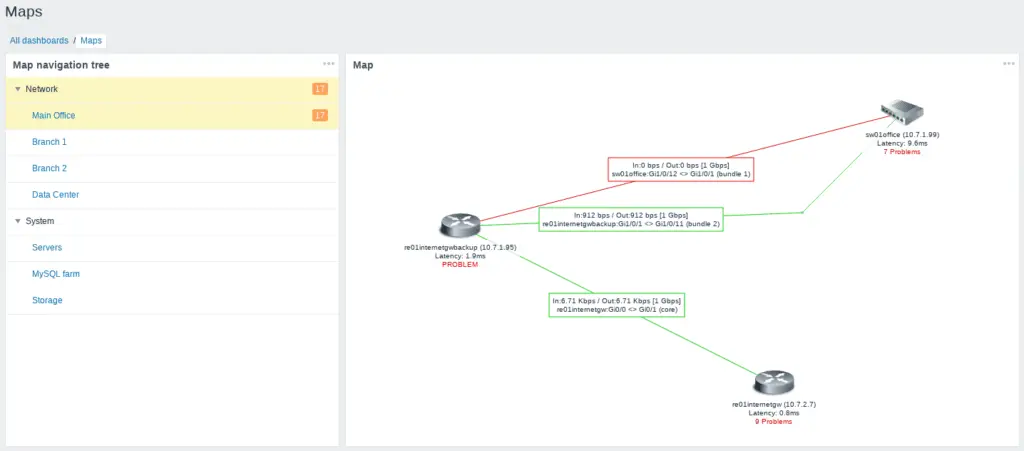
In this tutorial, linked below, you will learn how to create an interactive Zabbix network map that can display link traffic (bandwidth) and change the color of the link if there are any issues (red if the link goes down or yellow if there is high utilization) and how to use the Zabbix Geomap functionality.
Tutorial – How to Create Interactive Zabbix Maps
Don’t worry if you have never created a Zabbix map, because I will guide you step-by-step using various examples.
Optimizing Zabbix
a) Proxy servers
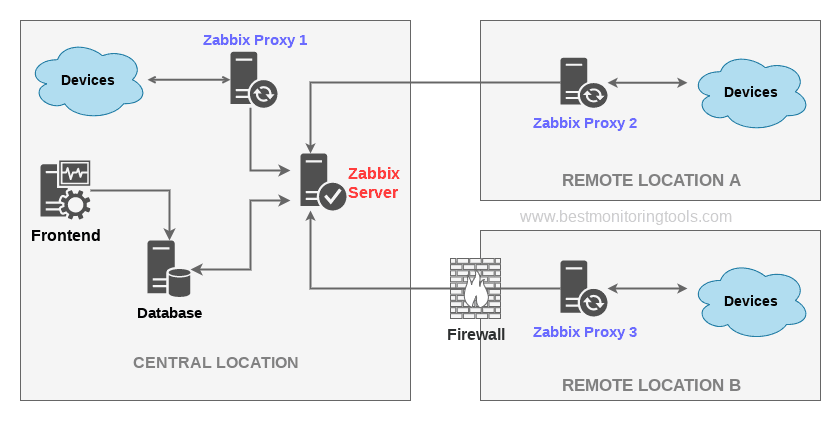
A Zabbix proxy is a useful tool that can gather performance and availability data from remote devices on behalf of the Zabbix server. This service may not be required for everyone, but it can be useful in situations where remote locations have firewalls or poor connectivity. Additionally, it can be useful in large environments where the Zabbix server needs to be relieved of some of its workload.
Please choose the instructions for your preferred operating system below:
- Tutorial – Zabbix-Proxy Installation Guide for CentOS, RHEL, Oracle/Alma/Rocky Linux
- Tutorial – Zabbix-Proxy Installation Guide for Ubuntu
- Tutorial – Zabbix-Proxy Installation Guide for Debian
- Tutorial – Zabbix-Proxy Installation Guide for Raspberry Pi OS
And lets learn how to install the latest version of the Zabbix proxy server and make key optimizations to improve its performance.
b) How to optimize Zabbix MySQL / MariaDB database?
There is good guide on Zabbix blog about MySQL / MariaDB optimization. However, I will share a tutorial that provides a ready-to-go configuration with minimal changes needed on your end.
Tutorial – How to optimize Zabbix MySQL / MariaDB database?
Please try the provided tutorial and let me know in the comment section how much the Zabbix performance improved.
Maintaining Zabbix
a) Upgrading Zabbix
The Zabbix team follows a program of scheduled releases on a six-month basis, as outlined in the Zabbix life cycle & release policy page. This means that every six months, a new stable version of Zabbix will be released. To ensure a seamless transition to the new version, it’s recommended to follow the upgrade guide provided below, which includes best practices and tips for the upgrade process.
Tutorial – The Ultimate Guide to Upgrading Your Zabbix Server
It is important to note that the Zabbix team also releases hotfixes every few weeks. To ensure that you are always using the most up-to-date version, it is recommended to perform a minor upgrade at least once a month, which is also covered in the tutorial. Minor upgrades are relatively safe and do not require a backup, for example, upgrading from 6.0.0 to 6.0.4.
b) Importing SNMP MIB to Zabbix
Zabbix can be utilized without MIB files by using OIDs instead of Object Names in items. For instance, use 1.3.6.1.4.1.3375.2.1.4.2.0 instead of F5-BIGIP-SYSTEM-MIB::sysProductVersion.0. However, if you need to use Object Names for your specific device, then you need to import that device’s MIB to Zabbix using the tutorial below.
Tutorial – How to Import SNMP MIB to Zabbix
Are you familiar with the SNMP protocol? No? Don’t worry, I got you covered with my post – What is SNMP protocol? How does it work? Learn with examples.
Conclusion
That’s it for now! I hope this tutorial has been a helpful resource for you, whether you’re new to Zabbix or an experienced user.
Even though I have provided step-by-step guides on various aspects of using Zabbix, keep in mind that this is just the start of your journey with Zabbix. I encourage you to explore further using the official Zabbix integration and documentation pages.